8. Sharing Maps and Reproducible Projects
4:00 - 5:00 p.m.
Lecture 15 min · Hands-on 25 min · Wrap-up and questions 10 min · Break 4:50 - 5:00
Learning goals
- Build a story map that walks a reader through your findings.
- Share a project as a public link, embed it in a web page, or export it as a standalone HTML file.
- Reproduce a map from Python with the
geolibrepackage. - Leave with a plan for using GeoLibre in your own work.
Lecture (15 min)
What makes a map reproducible?
A reproducible map is one that someone else can open, inspect, and rebuild without you. GeoLibre projects get there by design:
- A
.geolibre.jsonproject records where every layer comes from (a URL, service, or query), how it is styled, the camera, and plugin state. It is plain JSON, so it diffs cleanly in Git. - Cloud-hosted data means the project points at the same source for everyone, not at a copy on one person's laptop. Static files (COG, GeoParquet, PMTiles) give everyone identical bytes as long as the file is not replaced; live services (WMS, WFS, OGC API, STAC searches) can return different results over time, so record the date you used them.
- Layers computed in the browser (a hillshade, a SQL result) are either embedded in the project (small vector results) or flagged as not saved (rasters), so you know what a recipient will see.
Ways to share
| Method | Result | Needs |
|---|---|---|
| Project → Save | A .geolibre.json file |
Nothing |
Host the file anywhere public, open with ?url= |
A link anyone can open | A static host that allows cross-origin (CORS) requests, such as GitHub Pages or a public S3 bucket with a CORS rule |
| Project → Share... | A public link on share.geolibre.app |
A free share.geolibre.app sign-in |
?url=...&layout=viewer in an <iframe> |
An embedded, read-only map | A web page |
| Project → Export → Export as HTML... | One self-contained HTML file with the project embedded | Nothing to host; it still loads the GeoLibre viewer, basemap, and data from their URLs |
| Project → Story map... | A chapter-by-chapter narrative, presented in the app or exported as HTML | Nothing |
Python geolibre package |
The same map built from code in Jupyter | pip install geolibre |
Before sharing, the Share dialog runs a share-readiness check: it lists layers a recipient will not be able to load (local files, hosts without CORS, expired URLs) and strips credentials such as API keys from the upload.
Hands-on (25 min)
Open the Section 7 project, or your own, and rename it
NGIS 2026 - 8 Story map and sharing. If the Time slider is still bound,
deactivate it with Plugins → Time slider so all earthquakes show.
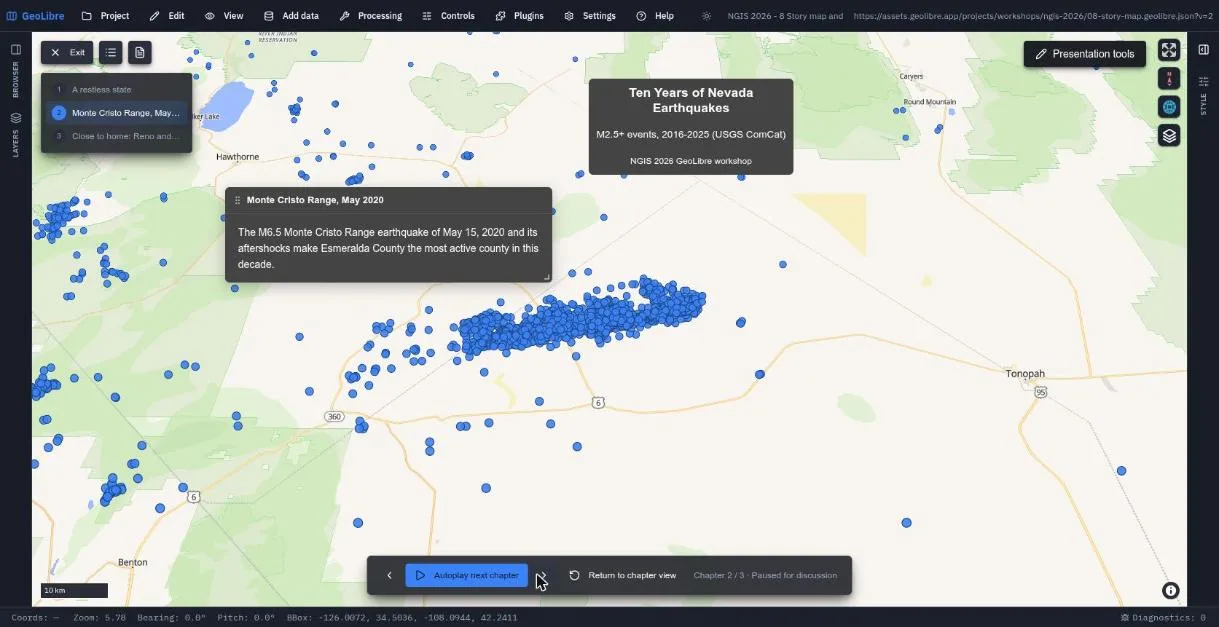
Exercise 8.1: Build a three-chapter story map (12 min)
- Choose Project → Story map....
- Fill in Title
Ten Years of Nevada Earthquakes, SubtitleM2.5+ events, 2016-2025 (USGS ComCat), and Byline with your name. - Zoom the map to all of Nevada and click Add chapter. Each chapter
captures the current camera. Title it
A restless stateand add a one-sentence description. - Use View → Set view... to move to the Monte Cristo Range
(longitude
-117.87, latitude38.17, zoom9.2, pitch45). Click Add chapter, title itMonte Cristo Range, May 2020, and describe the M6.5 event and its aftershocks. - Move to Reno and Lake Tahoe (longitude
-119.85, latitude39.35, zoom8.8, pitch30). Add a third chapter,Close to home: Reno and Lake Tahoe. - If you moved the map after adding a chapter, open the chapter and click Set to current view to re-capture it.
- Click Present. Step through the chapters with the arrows, or click Play automatically. Click Exit when done.
Exercise 8.2: Share it (8 min)
Pick at least one:
-
A file plus a link. Save the project, put the file on any public web host (for example a GitHub repository with Pages turned on), and open it with:
https://web.geolibre.app/?url=https://YOUR-HOST/your-map.geolibre.jsonThe host must send CORS headers that allow
https://web.geolibre.app(GitHub Pages does). If the project URL itself contains?or&, encode it first, for example with JavaScript'sencodeURIComponent. -
share.geolibre.app. Choose Project → Share..., click Sign in, approve the popup, review the readiness list, and share. You get a public URL like
https://share.geolibre.app/you/my-map.geolibre.json. -
Embed. Paste this into any HTML page (here using the finished project):
<iframe title="Ten Years of Nevada Earthquakes story map" src="https://web.geolibre.app/?url=https://assets.geolibre.app/projects/workshops/ngis-2026/08-story-map.geolibre.json&layout=viewer" width="100%" height="600" style="border:0" allowfullscreen> </iframe> -
Standalone HTML. Project → Export → Export as HTML... writes one file you can email or open from disk. The story map builder also has Export HTML for a scroll-driven story page and Handout (PDF).
Exercise 8.3: The same map from Python (5 min, optional)
In any Jupyter environment (a local notebook, JupyterLab, VS Code, or Google Colab):
%pip install geolibre

from geolibre import Map

base = "https://assets.geolibre.app/data/workshops/ngis-2026/"
m = Map(center=(-119.8, 39.4), zoom=8)
m.add_basemap("positron")
m.add_cog(base + "reno_tahoe_dem.tif", name="Reno-Tahoe DEM", colormap="terrain")
m.add_geojson(base + "nv_counties.geojson", name="Nevada counties")
m.add_csv(base + "nv_earthquakes.csv", name="Nevada earthquakes")
m.save_project("my-workshop.geolibre.json")
m
The full GeoLibre app renders inside the cell. This is a partial map (the
layers, without the story chapters), but the saved
my-workshop.geolibre.json opens in the web and desktop apps, so a notebook
and a point-and-click session produce the same kind of artifact. To reopen a
saved project in a notebook, including one you saved from the web app with
its story map, use m.load_project("my-workshop.geolibre.json") with that
file's path.
Wrap-up (10 min)
Today you:
- Read data where it lives: GeoJSON, CSV, FlatGeobuf, GeoParquet, COG, PMTiles, Zarr, and EPT, all over HTTP.
- Found imagery through a STAC catalog and combined it with OGC map and feature services.
- Ran spatial SQL, buffers, and terrain analysis without a server.
- Streamed a billions-of-points LiDAR survey of Reno in 3D.
- Extended the app with plugins and an AI assistant.
- Packaged everything as projects that open from a single link.
Take two minutes to write down one dataset or workflow from your own job that you could move to this model, and what is blocking it today (data format, hosting, CORS, credentials, or habits).
Keep learning
- GeoLibre documentation, Tutorials, and Video Tutorials
- Gallery of shared projects to open and fork
- Source code and issue tracker: github.com/opengeos/GeoLibre
- Questions, bugs, and feature requests: open an issue or a discussion on GitHub
Check your work
The finished project opens straight into the story map presentation.
End of workshop, 5:00 p.m. Thank you for attending! Return to the workshop overview.