Print Layout
Project → Print Layout... composes a print-ready map with a title, legend, scale bar, north arrow, and optional data blocks, then exports it to PNG, PDF, or SVG. It can also generate an atlas: a map series with one page per feature or a run of pages along a line.
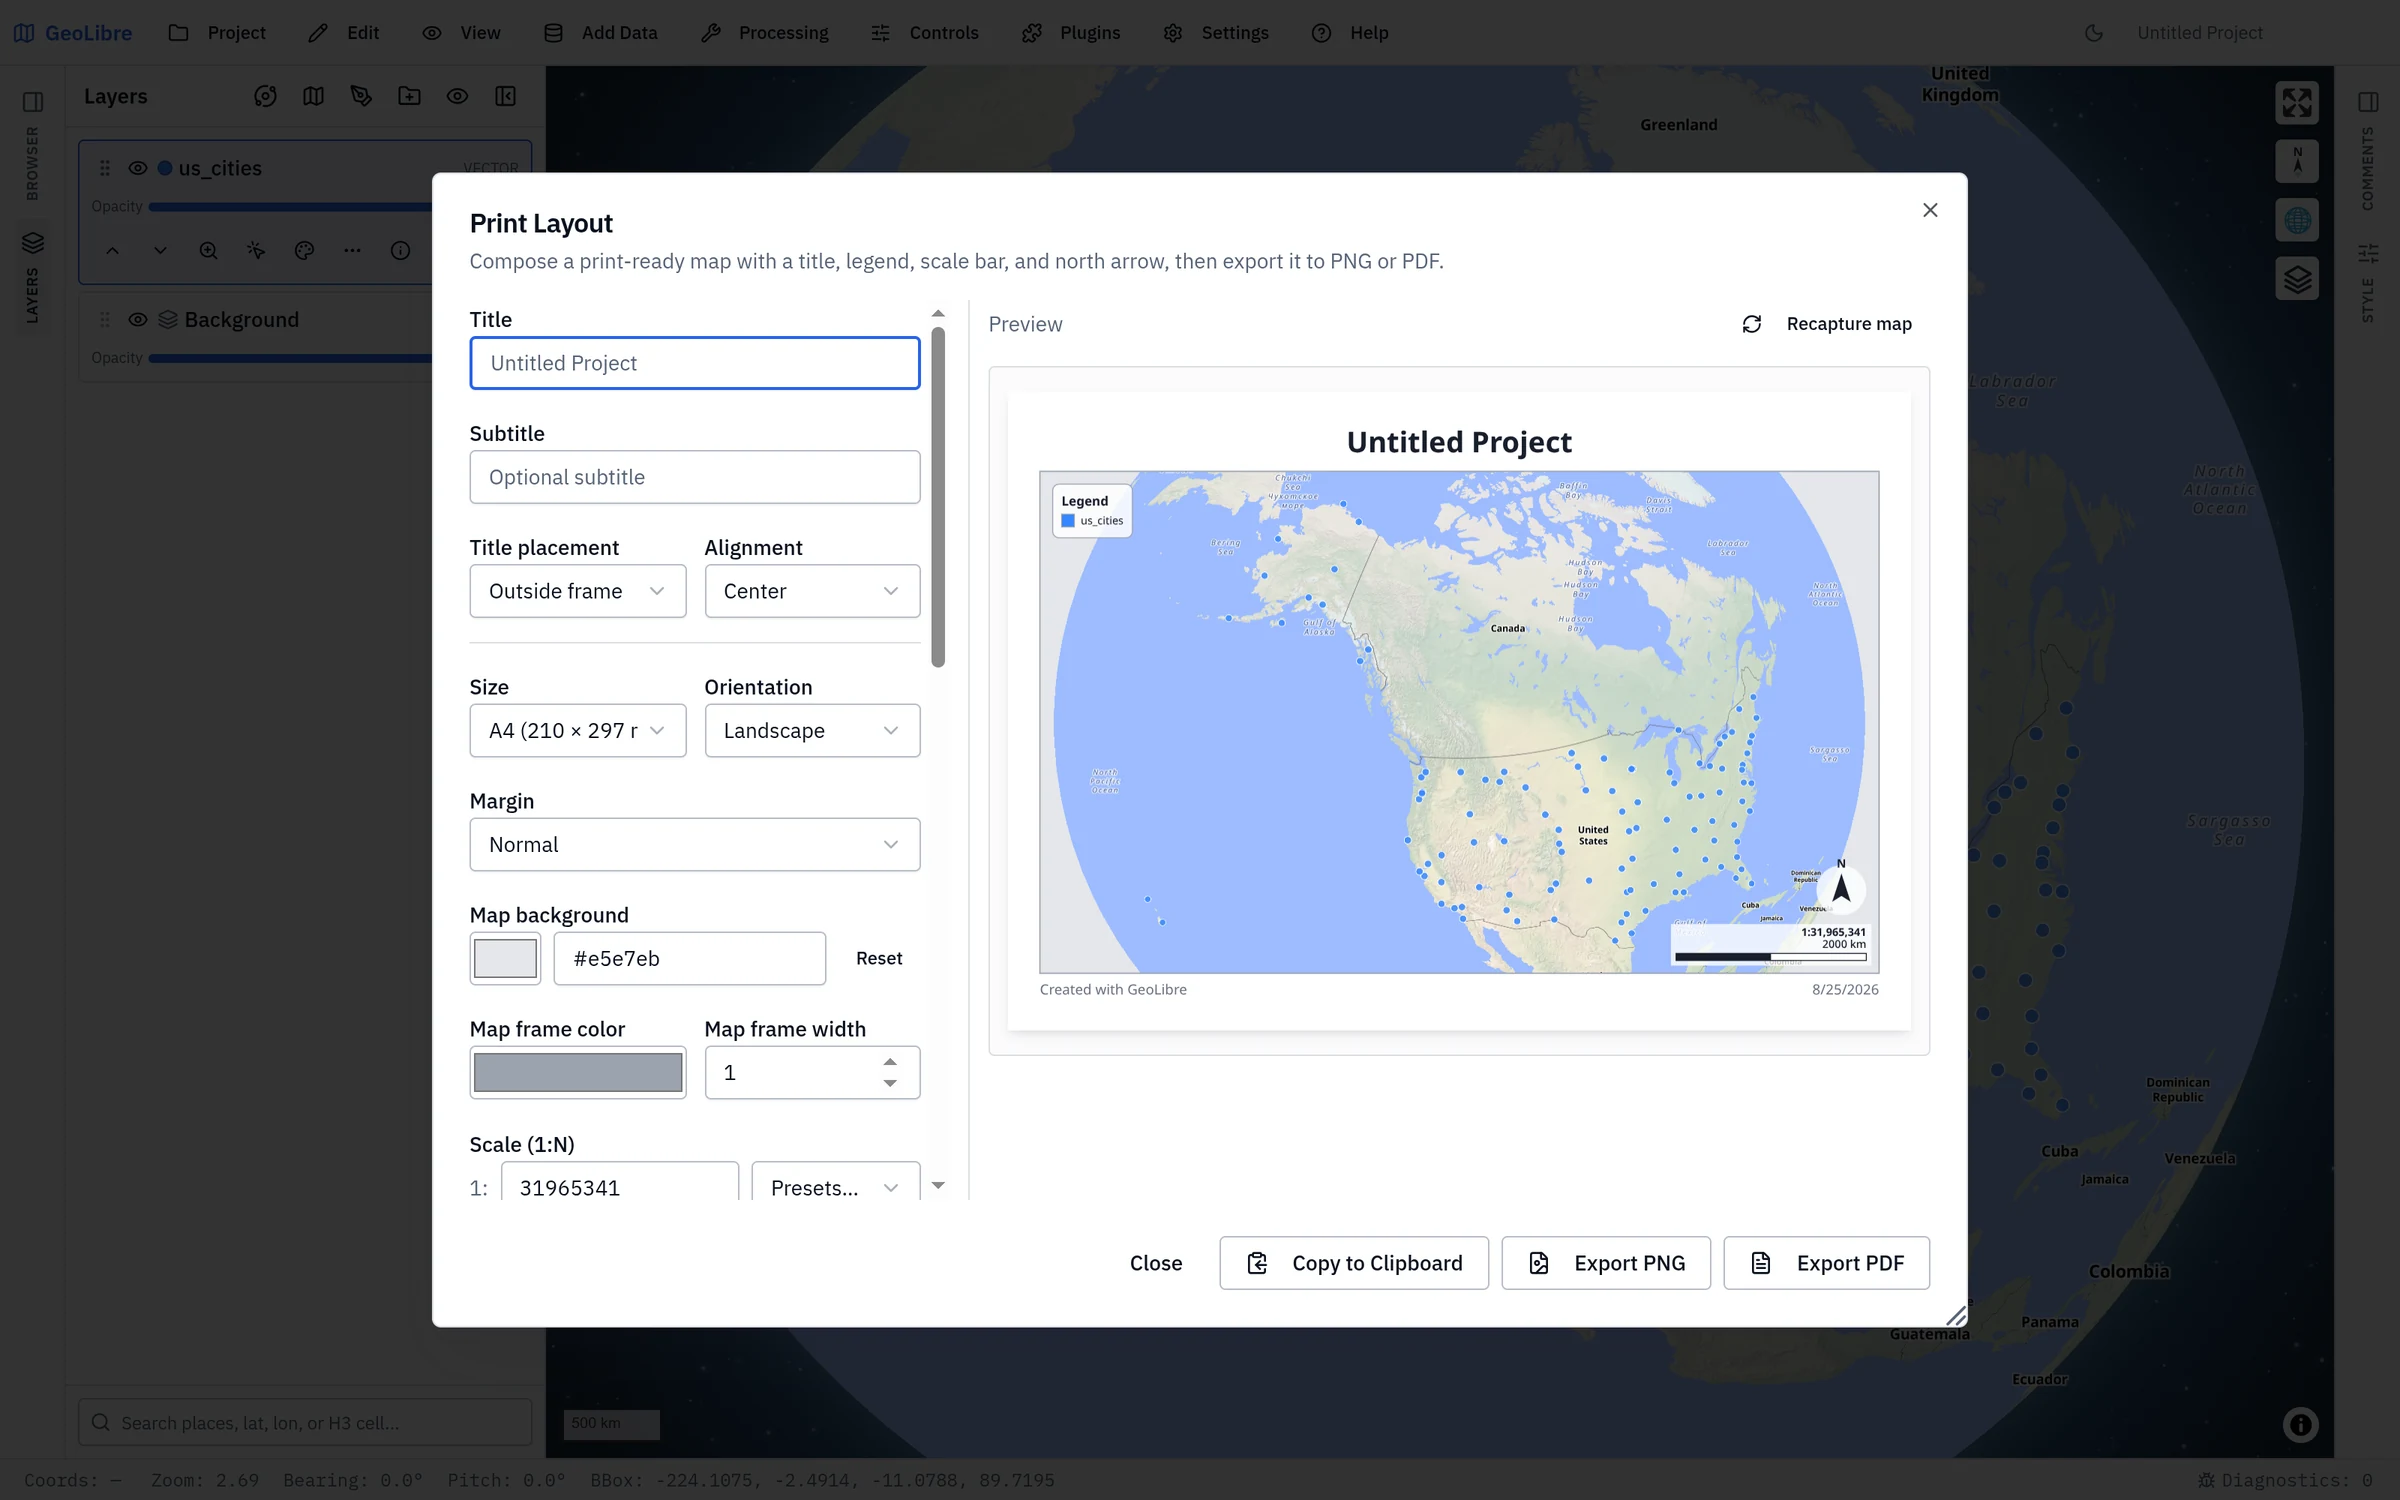
The controls are on the left and the live Preview on the right. The preview is built from a capture of the live map; after you pan, zoom, or restyle the map, press Recapture map to refresh it. Drag the splitter between the two halves, or the dialog's corner grip, to make more room.
The layout is saved with the project, so reopening the composer brings back the same page, elements, and atlas settings. A project has one layout.
Title
Title (defaults to the project name) and Subtitle head the page. Title placement puts them Outside frame (above the map) or Inside frame (over it), and Alignment sets Left, Center, or Right.
Page
Size offers paper and screen presets:
| Group | Sizes |
|---|---|
| Paper | A4 (210 × 297 mm), A3 (297 × 420 mm), Letter (8.5 × 11 in), Legal (8.5 × 14 in), Tabloid (11 × 17 in) |
| Screen / digital | Full HD (1920 × 1080 px), HD (1280 × 720 px), 4K UHD (3840 × 2160 px), Square (1080 × 1080 px) |
Custom… takes a Width and Height in px or mm. Orientation switches between Portrait and Landscape (not for custom sizes), and Margin is Normal, Narrow, or None (borderless).
Map frame, scale, and extent
- Map frame: the Map background color shows where the map has no data;
Map frame color and Map frame width draw the border around the map
(width
0hides it). - Scale (1:N): type a scale or pick one from Presets… (1:500 up to 1:100,000). Applying it zooms the live map to that scale and recaptures. It is available on paper (mm) pages once the map has been captured. If the map's zoom limits cannot reach the scale, the composer uses the closest one it can and says so.
- Print extent: Draw extent on map lets you drag a box on the map to set
the exact print area; hold
Shiftto match the page proportions. Then choose Use active viewport or Clip to custom extent, or Clear extent. While clipping to a custom extent, the scale input is disabled because the extent fixes the scale.
Map elements
Tick the elements to place on the page under Map elements:
| Element | Notes |
|---|---|
| Title, Subtitle | See Title. |
| Legend | Built from the visible layers. See Legend editor. |
| Scale bar, North arrow | Group north arrow & scale bar places them together. |
| Date | The export date. |
| Include GeoLibre attribution | Adds "Created with GeoLibre". |
| Footer text | Free text along the bottom of the page. |
| Page border | With Border color and Border width. |
| Info block (title block) | An engineering-style block with Author, Project No., CRS, Revision, and the scale. |
| Colorbar | A continuous color scale with Colormap, Min value, Max value, Label, Orientation, Position, and Length. |
| Custom legend | Hand-made legend entries. See Custom legend. |
| Attribute table | A table of a layer's records. See Data blocks. |
| Chart | A bar, pie, or line chart. See Data blocks. |
Blocks snap to the page corners through their Position setting; there is no free placement by dragging. The composer has no free text boxes, image or logo elements, inset maps, or layout grid. A coordinate grid on the map itself (Controls → Gridlines) is captured with the map, and the map is fitted so its edge labels are not cropped.
Legend editor
When Legend is ticked, the legend editor lists one entry per visible layer (and its classes). For each entry you can:
- edit the label to rename it on the page,
- hide or show it with the eye button,
- move a layer entry up or down.
Legend title sets the heading, Group classes by layer nests classes under their layer, and the reset button returns to the automatic legend. The editor changes the project's legend, the same one Controls → Legend shows, so edits appear in both places. Entries come from layers; to add items that are not layers, use a custom legend.
Custom legend
Custom legend draws a legend you build by hand: a Legend title, then a
color and Label for each row, with Add item and remove buttons, and a
Position. Import from dictionary replaces the rows from JSON such as
{"Forest": "#228b22", "Water": "#1e90ff"}.
Data blocks
Attribute table and Chart read a vector layer whose features are loaded in the app (a GeoJSON or other local vector layer).
- Attribute table: choose the Layer, a Heading, the Columns, Sort by and Order, and Max rows (up to 50), or Adjust number of rows to fit page.
- Chart: choose the Layer, a Chart type (Bar, Pie, or Line), the Category field, and an Aggregate (Count, Sum, or Mean, with a Value field for the last two).
Both take a Page extent filter: All features, only features completely within the page extent, or only features intersecting it. In an atlas they can also show only the current atlas feature.
Atlas (map series)
Tick Generate a multi-page map series to turn the layout into a template that is repeated for a series of extents. The atlas needs a flat map; it is not available on the Cesium globe or the ArcGIS 3D scene.
- Pick a Coverage layer, a vector layer whose features drive the pages.
- Choose the Coverage:
- One page per feature frames each feature in turn.
- Pages along a line walks each line feature in order, one page per Segment length (km) (20 km by default). A series is capped at 5,000 pages; increase the segment length if you hit the cap.
- Choose a Page name field (by default the feature number).
- Set the Page extent: Margin around feature (a percentage) or, on paper pages, a Fixed scale.
- Optionally:
- Mask area outside current feature dims everything outside the current polygon (one page per feature, polygon layers only).
- Sort by and Order set the page order (one page per feature).
- Filter limits the pages to matching features, for example
POP2000 > 100000 and ST = "CA". Comparisons are=,!=,>,>=,<,<=, andcontains, joined withand.
The preview shows Page X of Y with previous and next buttons, and moves the live map to each page's feature.
Atlas tokens
Use these tokens in the title, subtitle, footer, and the Page file name (ZIP export):
| Token | Value |
|---|---|
{atlas.name} |
The page name. |
{atlas.pagenumber} |
The page number. |
{atlas.total} |
The number of pages. |
{atlas.attr:FIELD} |
The current feature's FIELD value. Along a line, km_start, km_end, segment, and segments are also available. |
The default page file name is {atlas.pagenumber}-{atlas.name}.
Exporting
| Button | Output |
|---|---|
| Export PNG | A raster image of the page. In an atlas it becomes Export PNG ZIP: one PNG per page in a ZIP file. |
| Export PDF | A PDF page of the chosen size. In an atlas it becomes Export PDF (N pages): one multi-page PDF. |
| Export SVG | An SVG of the page. Not available in an atlas. |
| Copy to Clipboard | The page as a PNG on the clipboard. |
The file is named after the title. Paper pages render at 150 DPI; screen presets and pixel custom sizes render at their exact pixel size. An atlas export reports its progress page by page, and the dialog stays open until it finishes.
What is vector and what is raster
SVG is the format to choose when the layout is going on to a vector editor such as Inkscape or Illustrator: the title, legend, scale bar, north arrow, tables, charts, and borders are written as editable text and paths. The map itself, and any image-based marker icons, stay embedded as images. The PDF is a 150 DPI image of the whole page placed on a PDF page, not vector content.
Getting a sharper map
The map is captured from the on-screen map, so its detail is limited by the size of the map on your screen, whatever the page size. Maximize the window (or use a high-DPI display) before Recapture map for a large print. Text and other layout elements are drawn at full output resolution.
A View → Color vision preview does not affect exports: the layout is always exported in the map's real colors.