Video Tutorials
Recorded walkthroughs of GeoLibre, oldest first — start at the top for a guided tour, or jump to the one that matches your task. Every video is part of the GeoLibre playlist on the Open Geospatial Solutions channel — subscribe there to catch new ones.
For written, step-by-step versions of the same workflows, see the Tutorials overview; for a still-image tour of the app, see Demos.
GeoLibre 1.0: A Free, Open-Source Cloud-Native GIS That Runs Anywhere
40:18 · June 2026 · Watch on YouTube
The full introduction, and the best place to start. Installs and runs all three builds — browser, desktop, and Jupyter — then works through projects, vector and raster data, attribute and geometry editing, streaming a 180 GB dataset without downloading it, PMTiles, 3D tiles, LiDAR, DuckDB, the map controls, and sharing.
Related: Getting Started · Interface Overview · Your First Map
Topics covered
The chapter timestamps in the video description run past the recording's 40:18 length, so they are listed here without times.
- What GeoLibre is, and the three ways to run it (browser, desktop, Jupyter)
- The responsive web layout and light/dark mode
- Installing the desktop app; running GeoLibre in a Jupyter notebook
- Saving and loading projects; the website tour and the tech stack
- 3D tiles and navigating the map canvas; the Layers and Style panels
- Creating a project and choosing a basemap
- Drag-and-drop vector data and the identify tool
- Attribute table: select, edit, and export; editing geometry
- Drag-and-drop raster data (DEM); adding a GeoParquet layer
- Streaming a 180 GB vector dataset without downloading it
- Vector styling: zoom levels, labels, 3D extrusion
- Raster data: COGs, local files, color maps, pixel inspection
- CSV/lat-long points, GPS (GPX) tracks, and XYZ/WFS/WMS services
- PMTiles (Overture buildings) in 2D and 3D; LiDAR point clouds and 3D tiles
- Connecting to DuckDB
- Map controls: scale, terrain, search, color bar, legend, measurement, bookmarks, minimap
- Plugins, sharing projects, tokens, and map-only embed links
Geoprocessing in the Browser: 700+ Free GIS Tools in GeoLibre, Zero Install
21:52 · June 2026 · Watch on YouTube
The Whitebox Next Gen toolbox running entirely on WebAssembly — terrain, hydrology, LiDAR, remote sensing, raster, and vector tools, with nothing installed. Walks the category-browsable Processing menu, runs terrain and hydrology tools on a DEM, and covers plugins, large local files, and the JupyterLite panel.
The toolbox has since grown past 1,000 tools; see Processing Tools for the current list.
Related: Terrain Analysis · Vector Analysis · Notebook Panel
Chapters
- 00:00 Introduction and GeoLibre 1.7 overview
- 03:10 Opening the web app and creating a project
- 04:03 Adding data and styling raster layers
- 06:26 Web-based geoprocessing with Whitebox tools
- 09:18 Running terrain and hydrology analysis
- 12:03 Vector data, labels, and centroid processing
- 14:38 Plugins and extending GeoLibre
- 17:39 Loading large local files
- 20:25 JupyterLite and field data collection
- 21:31 Wrap-up and feedback
Access Free High-Resolution Disaster Satellite Imagery in Your Browser
8:26 · July 2026 · Watch on YouTube
Installs the Vantor Open Data plugin, searches its STAC catalog for a disaster event, and compares pre- and post-event high-resolution imagery on the map — then downloads the original Cloud Optimized GeoTIFFs and shares the result as a link.
Related: Plugins & Marketplace · Adding Data
Chapters
- 00:00 Introduction
- 00:53 What is GeoLibre and Vantor Open Data?
- 01:27 Installing the Vantor Open Data plugin
- 02:30 Browsing disaster events
- 03:00 Searching pre- and post-event imagery
- 03:55 Visualizing high-resolution satellite imagery
- 04:21 Comparing before and after imagery
- 05:06 Identifying earthquake damage
- 05:54 Downloading original imagery
- 06:18 Loading multiple image scenes
- 07:05 Accessing source URLs and sharing maps
- 07:53 Automatic STAC catalog updates
- 08:20 Wrap-up
Regularize Building Footprints in the Browser with GeoLibre
16:25 · July 2026 · Watch on YouTube
Cleans up irregular building polygons — the kind an AI segmentation model or hand digitizing produces — with the Rust-based regularization tool, entirely in the browser. Covers loading the data, projected coordinate systems, tuning the parameters, comparing before and after, and exporting the result.
Try it yourself with the live sample project.
Related: Processing Tools · AI Segmentation
Chapters
- 00:00 Introduction
- 00:30 Why building footprint regularization matters
- 01:00 The traditional Whitebox workflow
- 02:20 GeoLibre overview
- 03:05 Launching GeoLibre in the browser
- 04:05 Loading sample building data
- 05:00 Importing your own building footprints
- 06:10 Coordinate systems and data preparation
- 06:45 Opening the building regularization tool
- 07:20 Configuring tool parameters
- 08:05 Running the tool and comparing results
- 09:05 Understanding regularization options
- 10:10 Working with different building shapes
- 11:10 Exploring additional Whitebox tools
- 12:20 Example: extracting urban areas
- 13:20 GeoLibre's Whitebox integration
- 14:30 More geoprocessing tools in GeoLibre
- 15:30 GeoLibre desktop and mobile apps
- 16:10 Downloading GeoLibre
- 16:17 Conclusion
GeoLibre + GeoLens: A Modern GIS Stack for Self-Hosting Geospatial Data
25:41 · August 2026 · Watch on YouTube
Pairs GeoLibre with GeoLens for a fully self-hosted stack: deploy GeoLens, browse its catalog from GeoLibre, build a 3D NYC map with extrusions and expression-driven styling, animate building growth over time, then edit footprints and push the edits back to GeoLens.
Related: Data Integrations · Styling Layers · Self-Hosting
Chapters
- 00:00 Introduction: a modern open-source GIS stack
- 01:15 Introduction to GeoLens
- 02:19 Exploring the GeoLens demo and data catalog
- 03:51 Introduction to GeoLibre
- 04:52 Self-hosting and managing data with GeoLens
- 06:31 Connecting GeoLibre to GeoLens
- 08:16 Exploring the NYC 3D sample project
- 08:58 Animating NYC building growth over time
- 10:21 Building a 3D NYC map from scratch
- 11:34 Creating 3D building extrusions
- 12:27 Styling buildings with expressions
- 14:41 Adding and styling NYC subway data
- 16:50 Creating a time animation
- 17:26 Sharing a GeoLibre project
- 17:52 Editing GeoLens data from GeoLibre
- 19:12 Loading editable GeoJSON data
- 20:02 Creating and editing building footprints
- 21:30 Saving changes back to GeoLens
- 22:27 Editing large vector datasets by map extent
- 23:03 Visualizing raster and Sentinel-2 data
- 24:23 GeoLens + GeoLibre as a modern GIS stack
- 24:29 Other GeoLibre data connectors and analysis tools
- 25:14 Conclusion
Create Reusable GIS Workflows with GeoLibre Model Builder and AI Assistant
18:55 · August 2026 · Watch on YouTube
Build graphical, reusable geoprocessing workflows in the browser: a simple vector chain first, then a full hydrology model that extracts a stream network from a DEM. The second half hands the same job to the AI Assistant, which assembles and wires the model from a natural-language prompt, and shows how to edit what it produced.
Related: Processing Tools · Terrain Analysis
Chapters
- 00:00 Introduction
- 00:49 Model Builder overview
- 02:23 Building a simple workflow
- 04:19 Running the model
- 04:54 Importing and exporting models
- 05:23 Building a hydrology workflow
- 11:08 Running the hydrology model
- 13:01 Building models with AI
- 14:46 Generating a workflow with a prompt
- 17:32 Customizing AI-generated models
- 18:25 Conclusion
Mapping the 2026 Nepal Floods with Free High-Resolution Satellite Imagery
23:14 · August 2026 · Watch on YouTube
A full disaster-response workflow on the Nepal–China border flood: find, view, compare, and download open imagery from Vantor Open Data, Planet Crisis Response, and OpenAerialMap. Builds a before-and-after swipe map, explores the valley in 3D terrain, pulls building footprints from Overture Maps, and exports the result for damage assessment.
Try it yourself with the live sample project.
Related: Plugins & Marketplace · Data Integrations · Map Controls
Chapters
As with the 1.0 tour, the last few chapter timestamps in the video description run past the recording's 23:14 length.
- 00:00 Nepal–China border flood seen from space
- 02:02 Building the before-and-after map
- 03:05 Finding the affected location
- 06:09 Searching Vantor Open Data
- 08:40 Exploring the terrain in 3D
- 12:08 Adding post-event satellite imagery
- 14:53 Comparing damage with Layer Swipe
- 18:39 Sharing the interactive GeoLibre map
- 20:06 Exploring Planet Crisis Response imagery
- 22:52 Finding imagery with OpenAerialMap
- 25:14 Extracting buildings from Overture Maps
- 27:20 Exporting data for damage assessment
- 28:30 Conclusion
Building Cloud-Native GIS Workflows with GeoLibre
1:07:28 · September 2026 · Watch on YouTube
A recorded webinar, and the longest single overview of the project. Covers how GeoLibre uses COG, GeoParquet, PMTiles, DuckDB, and WebAssembly to work with large vector, raster, and LiDAR datasets directly in the browser, then walks the plugin ecosystem, the cross-platform builds (browser, desktop, mobile, Jupyter, R), and the emerging GeoAI integration.
Slides: geolibre-slides-en.html
Related: Cloud-Native Data · Architecture · Python API · R Package
Image Georeferencing Using GeoLibre in the Browser
15:35 · September 2026 · Watch on YouTube
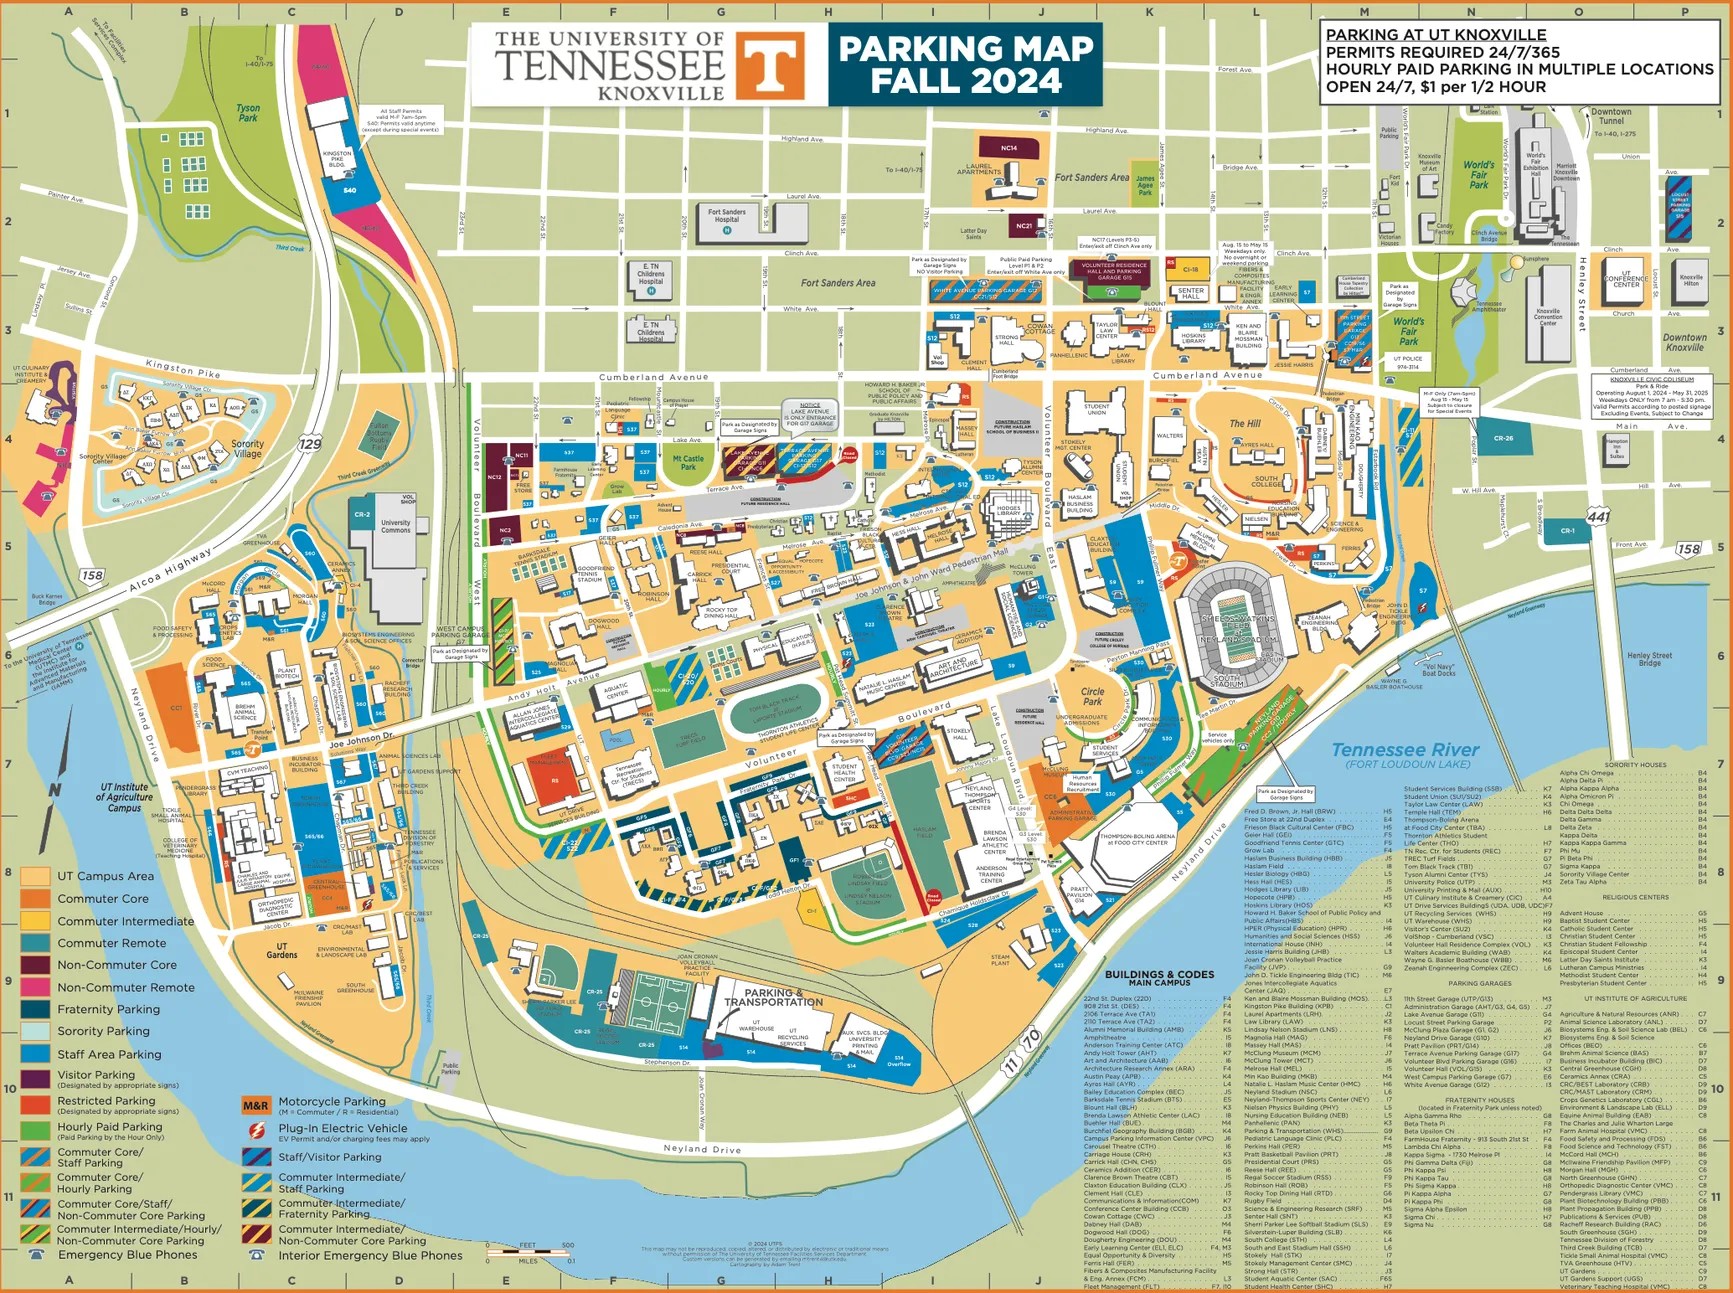
Georeferences a scanned University of Tennessee campus map with no desktop GIS: place ground control points, pick a transformation, read the per-GCP and RMS residuals, and align the image to a basemap. Then exports a GeoTIFF, reloads it, handles NoData transparency, compares it against the basemap with the swipe tool, and shares the finished map.
Sample data: UTK campus map · control points
Related: Processing Tools · Adding Data · Sharing & Embedding
Chapters
- 00:00 Introduction to image georeferencing
- 01:44 Launching GeoLibre and choosing a basemap
- 02:44 Opening the Georeferencing tool
- 03:20 Loading an image
- 03:50 Choosing a transformation method
- 04:55 Selecting ground control points
- 08:34 Checking coordinates and residuals
- 11:17 Evaluating georeferencing accuracy
- 11:30 Exporting control points and a GeoTIFF
- 12:26 Adding the georeferenced image to the map
- 12:59 Comparing layers with the swipe tool
- 13:35 Loading the exported GeoTIFF
- 14:07 Handling NoData and transparency
- 14:42 Sharing the georeferenced map
- 15:29 Conclusion
100 Interactive Maps from Open Data: Explore, Fork, and Build Your Own with GeoLibre
24:37 · September 2026 · Watch on YouTube
Tours the open data gallery: 100 interactive maps built entirely from free public data and open live in the browser. Shows how to explore and fork any of them, and how they were made, so you can build the same kind of map from your own data. The maps span 12 themes, from health and natural hazards to history and culture, with data from NASA, NOAA, USGS, CDC, the World Bank, Our World in Data, Eurostat, Wikidata, and more.
Related: Gallery · Official Demos collection · Python package
More videos
The channel also covers GeoAI, DuckDB, and geospatial Python more broadly:
Have a workflow you would like covered? Open a discussion and suggest it.