Attribute Table
The Attribute table shows the records of a vector or DuckDB layer. Open it from the layer's actions menu in the Layers panel with Open attribute table. It is available for GeoJSON layers (including files loaded from disk and layers produced by processing tools), CZML layers, Add Data → Vector Layer layers, and DuckDB query layers.
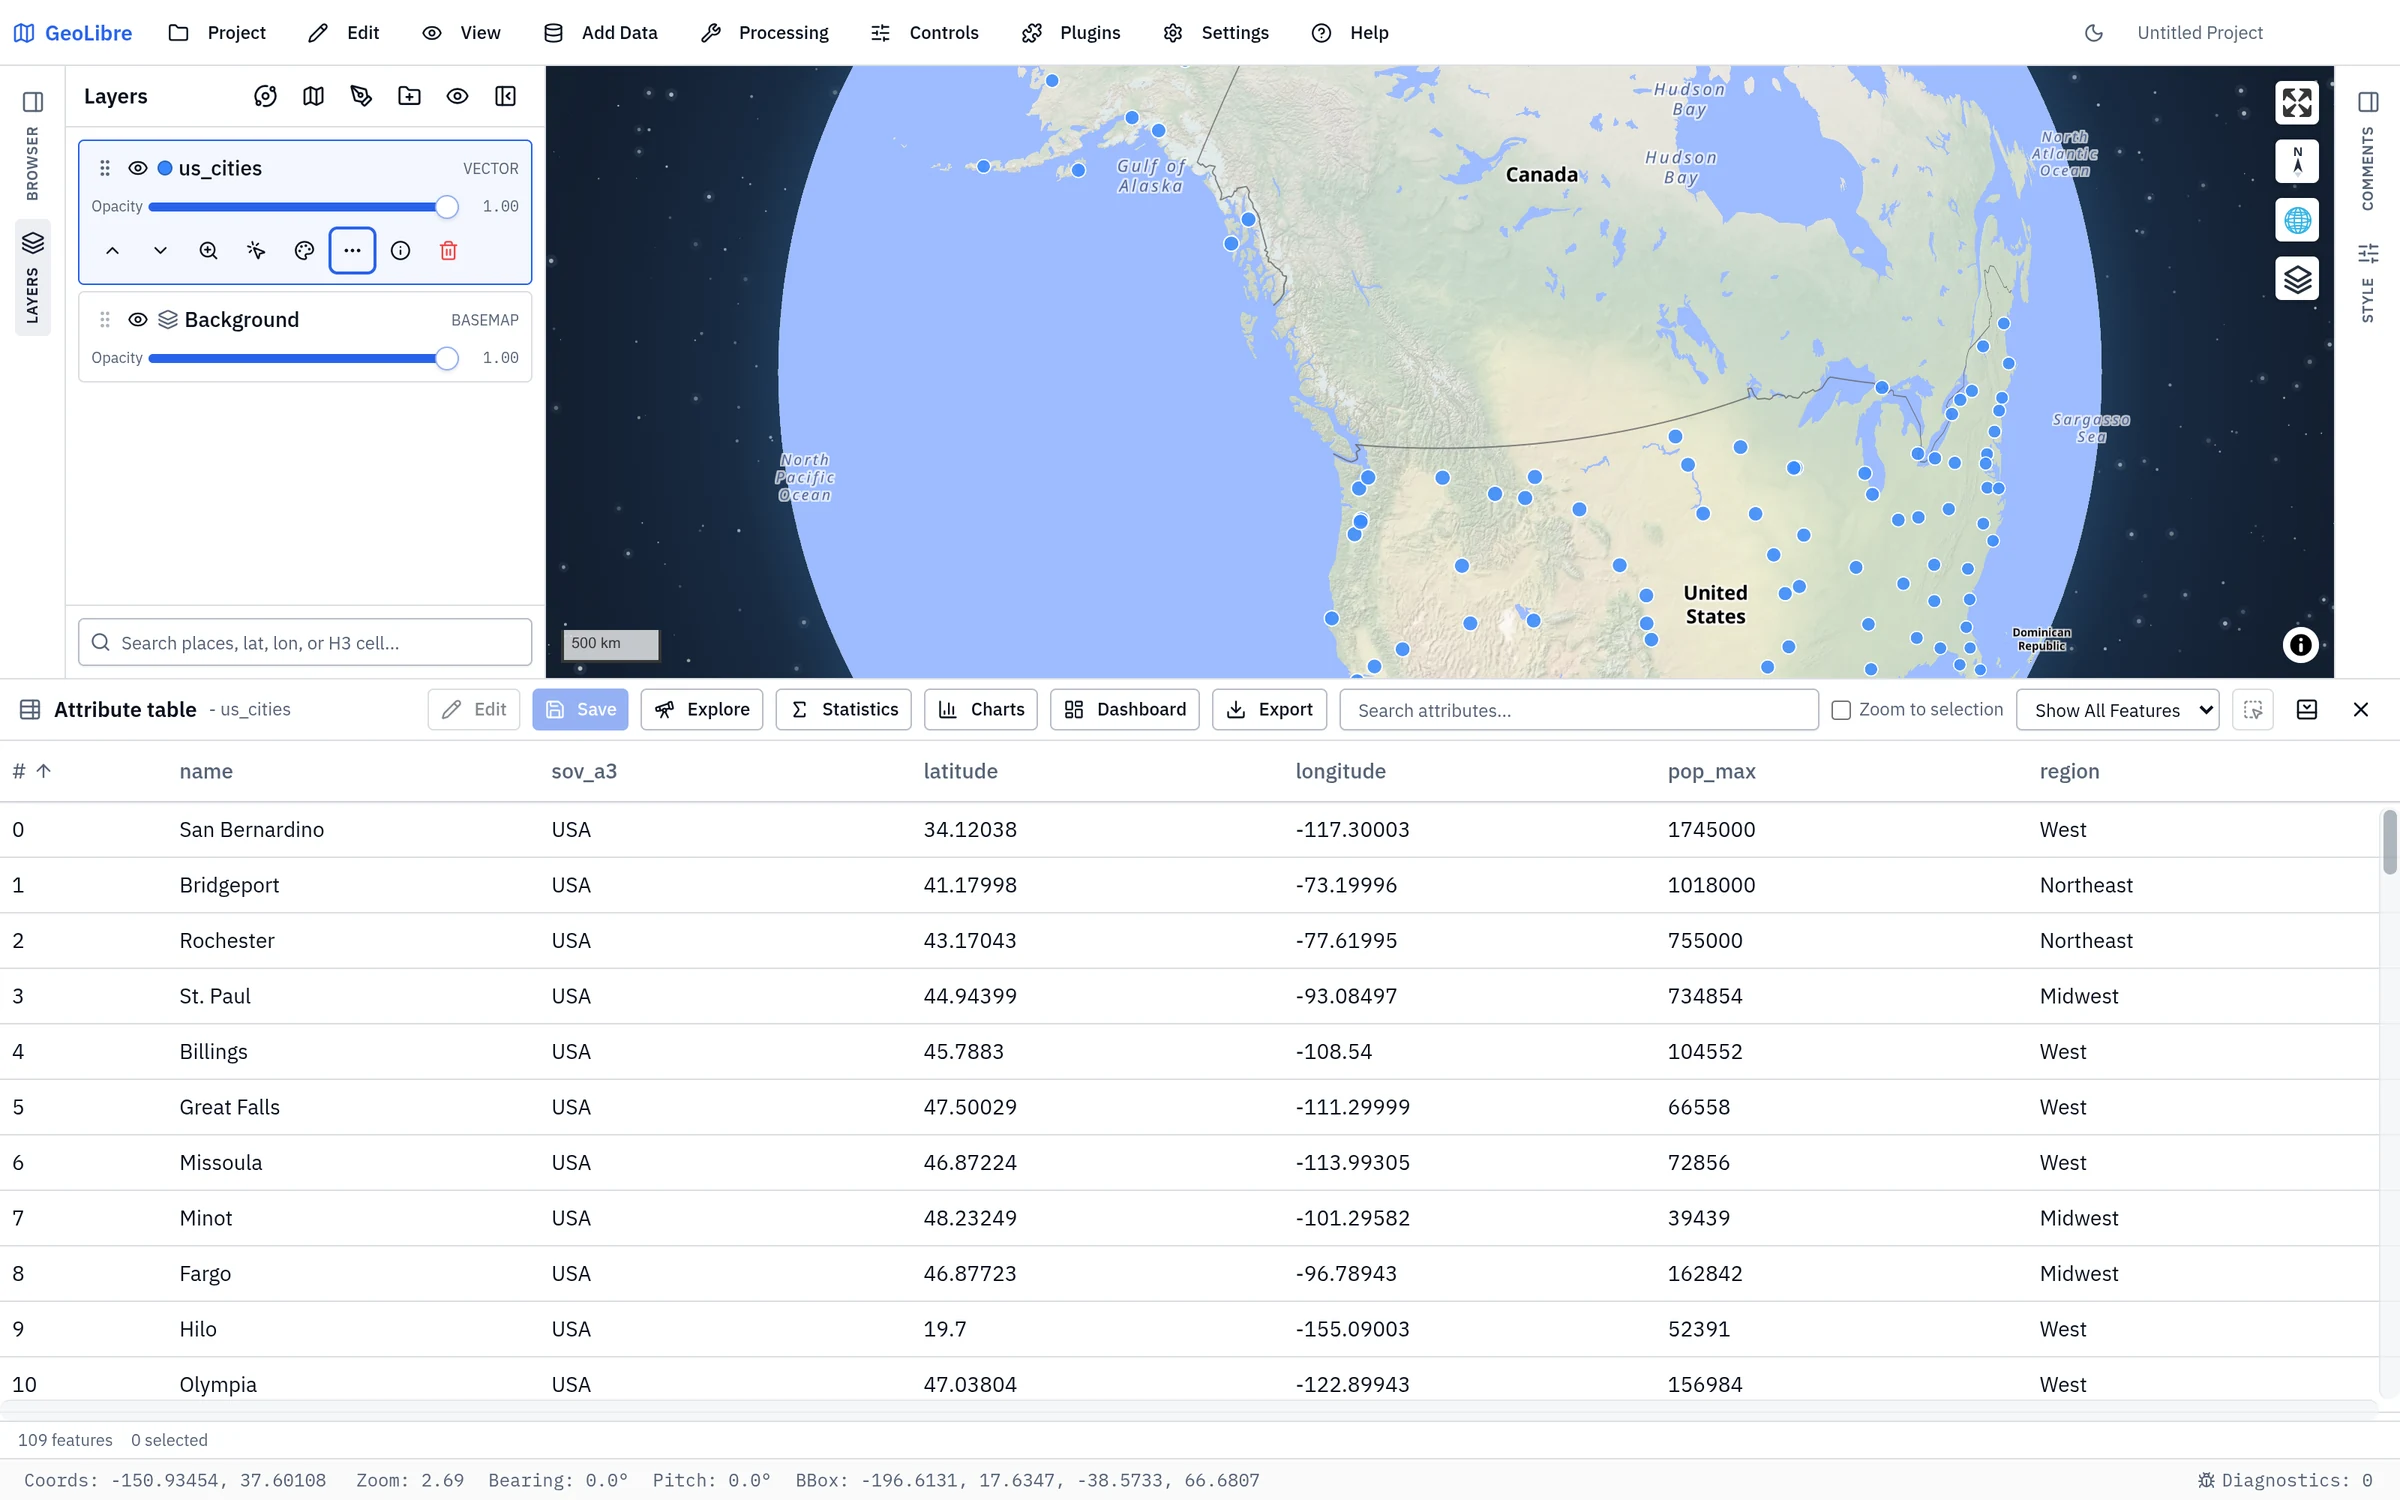
The table docks along the bottom of the window. Drag its top edge to resize it, or use the buttons at the end of the toolbar to collapse, expand, or close it. Rows are virtualized, so large layers scroll smoothly; there is no paging and no row limit, but sorting, searching, and the dialogs work over every row in memory.
The toolbar
| Button | What it does |
|---|---|
| Edit / Save | Turn on inline editing, then commit the changes. See Editing values. |
| Add field | Add a field to the layer. See Managing fields. |
| Calculate | Open the Field calculator. |
| Fields | Show or hide columns (Show fields, Show all fields). |
| Explore | Open the Column explorer. |
| Statistics | Summary statistics for one field. See Field statistics. |
| Charts | Chart one or two fields. See Charts. |
| Dashboard | Open the Dashboard with this layer preselected. |
| Refresh | Re-read the features from the source to pick up changes made elsewhere, such as edits by other clients of a service. Shown for layers that can be refreshed; on desktop, a layer read from a local file is reloaded from disk. Disabled while an ArcGIS layer has unsaved edits. |
| Export | Write the layer to a file. See Exporting. |
| Search attributes... | Show only rows whose values (or id) contain the text, ignoring case. |
| Zoom to selection | Zoom the map to each new selection. |
| Show All Features / Show Selected (n) | Show every record, or only the selected ones. |
| Clear selection | Deselect everything. |
Add field, Calculate, and Fields appear for editable GeoJSON layers when you are not editing. Explore, Statistics, Charts, and Dashboard are hidden while editing. On a narrow screen the buttons show only their icons.
The footer reports the number of features, how many are shown when a search or Show Selected narrows the list, and how many are selected.
Reading and navigating
- Sort by clicking a column header: ascending, then descending.
- Resize a column by dragging its border. Column widths are not saved.
- Open links: a cell that holds a URL shows a link that opens in your browser.
Selecting features
The table and the map share one selection:
- Click a row to select it,
Ctrl/Cmd+ click to add or remove a row,Shift+ click to select a range, andShift+Ctrl/Cmd+ click to add a range. - Selected rows are highlighted on the map, and a feature picked on the map scrolls the table to its row.
- Zoom to selection keeps the map framed on the selection as it changes, and Show Selected (n) narrows the table to it.
For selections by rule rather than by hand, use the Edit menu (also on the layer's actions menu):
| Command | What it does |
|---|---|
| Select by Expression... | Select features matching an expression, built by hand or with Expression builder.... Modify current selection by creates a new selection, adds to it, removes from it, or selects within it. The same dialog can instead Filter layer to save the expression as the layer's filter. |
| Select by Location... | Select features that intersect, are within, contain, or are disjoint from the features of another layer. |
| Invert Selection / Clear Selection | Flip or empty the selection. |
| Zoom to Selection | Fit the map to the selected features. |
| Export Selected Features as Layer | Copy the selection into a new layer. |
The layer's actions menu also has Select features, which draws a selection on the map by click, rectangle, polygon, freehand, or radius.
Managing fields
Each column header has a … menu with:
- Rename field: edit the name in the header;
Entersaves andEsccancels. Styles and labels that use the field follow the new name. - Hide field: hide the column (bring it back from Fields).
- Exclude field on export / Include field on export: keep the column in the table but leave it out of exported files.
- Move left / Move right: reorder the columns.
- Delete field: remove the field from every feature, after a confirmation. This cannot be undone, and it clears any style or label that used the field.
Add field asks for a Field name, a Type (Text, Number, or Boolean), and a Default value for the existing features. A field's type cannot be changed after it is created; calculate a new field instead.
Hidden fields, column order, and export exclusions are saved with the project. Field management is not available for DuckDB layers or Add Vector Layer layers, which are read-only here.
Calculated fields
GeoLibre has two kinds of calculated field.
Field calculator
Calculate writes values into a field once, like QGIS's field calculator. The expression itself is not kept.
- Under Target field, choose Update field (an existing field) or Create field (type a new name), and an Output type: Auto (keep computed type), Text, Number, or Boolean.
- Write the Expression. Refer to a field by its name, or as
props["field name"]when the name has spaces or punctuation; click a field or function chip to insert it.$indexis the row number, andPIandEare available. - Check the live Preview:, optionally tick Only update the selected features, and press Calculate.
Available functions: abs, ceil, floor, sqrt, exp, ln, log10,
pow, min, max, round(x, digits), toNumber, toString, upper,
lower, trim, length, concat, substr, replace, isNull, coalesce,
and iif(condition, then, else). Geometry measures are $length(unit),
$perimeter(unit), and $area(unit); the Geometry: row inserts them with a
unit for you, offering only the measures that fit the layer's geometry. Lengths
take meters (the default), kilometers, miles, feet, yards, or
nautical-miles; areas take square-meters (the default),
square-kilometers, square-miles, hectares, acres, or square-feet.
round($area("square-kilometers"), 2)
iif(pop > 100000, "city", "town")
upper(concat(name, " (", state, ")"))
A row whose expression fails is written as null, and a message says how many did.
Virtual fields
A virtual field is recomputed from an expression whenever the data changes,
like a QGIS virtual field. Add one in the layer's Style panel under
Virtual fields → Add virtual field, with a Field name and an
Expression in MapLibre expression syntax, for example
["/", ["get", "pop"], ["get", "area_km2"]]. Open builder opens the
Expression Builder.
Virtual fields are saved with the project and can be switched off without being deleted (Apply this virtual field). In the table they are read-only and shown in italics with a function icon; you can style, label, and filter by them like any other field.
Joins
A join adds the fields of another table to a layer by matching a key, like a QGIS table join. Joins live in the layer's Style panel under Joins:
- Add join, then choose the Join layer: any other layer with features (its geometry is ignored). To join a spreadsheet, use Choose file to load a CSV, TSV, TXT, or Excel file (with Worksheet and Delimiter options) as a table layer first.
- Pick the Join field in the join layer and the Target field in this layer.
- Choose the Fields to join (all but the key by default) and an optional
Field name prefix, such as
census_. - Add.
How a join behaves:
- It is a left join: every feature is kept, and features without a match get null in the joined fields. Each join reports how many features matched and how many join rows went unmatched.
- Keys are compared as text, so
5matches"5". Empty keys never match. - It is one-to-one: when several join rows share a key, the first wins.
- A joined field whose name already exists on the layer is skipped; use a prefix to avoid clashes.
- The join is live: it re-runs when either layer changes, and it is saved with the project. Apply this join switches it off without removing it.
Joined fields are read-only in the attribute table; edit the source table instead. For a permanent, one-off join (including an inner join), use Processing → Vector → Join → Attribute join, which writes a new layer.
Attribute forms
An attribute form controls how each field is edited, like QGIS's attributes form. Set it up in the layer's Style panel under Attributes Form, with Configure field for each field:
| Setting | Effect |
|---|---|
| Edit widget | Text, Number, Range, Checkbox, Date, or Value map (a dropdown). |
| Alias | A friendlier label for the field in forms. |
| Required | The field must have a value. |
| Value map entries | One per line, as value or value=Label. |
| Min, Max, Step | Bounds for Number and Range widgets (Step for Range). |
| Constraint expression / Constraint description | A MapLibre expression the value must satisfy, and the message shown when it does not. |
| Visibility expression | Show the field only when the expression is true. |
When you edit the table, value-map fields become dropdowns, checkbox fields become checkboxes, and number, range, and date fields get typed inputs. A cell that breaks a rule turns red with the reason (for example "A value is required"), and Save is blocked until it is fixed. Only problems your own edits introduce are flagged, so existing data that breaks a rule does not stop you saving other changes.
The same form drives Field Collection, so a layer set up here captures observations with the same widgets and rules. Aliases are used in forms, not as table headers. Attribute forms are not available for DuckDB layers.
Quick filters
Quick filters are point-and-click filters on the map, saved with the layer. Add them in the layer's Style panel under Quick filters → Add a filter…, one per field. Depending on the field, a filter is a list of Values with counts, a numeric Range, a span of Dates, or a Text match (contains, starts with, or is exactly). See Quick filters for the details.
Quick filters hide features on the map only: they do not narrow the attribute table and do not change the selection. To filter the table, use Search attributes... or Show Selected.
Column explorer
Explore profiles every field in the layer at once: its type, how many records are populated, how many are null, how many distinct values it holds, and the shape of its distribution — a ranked bar chart of the commonest values for text fields, a histogram with min, mean, and max for numeric ones. Filter the field list by name, and set the Scope to all features or only the filtered ones.
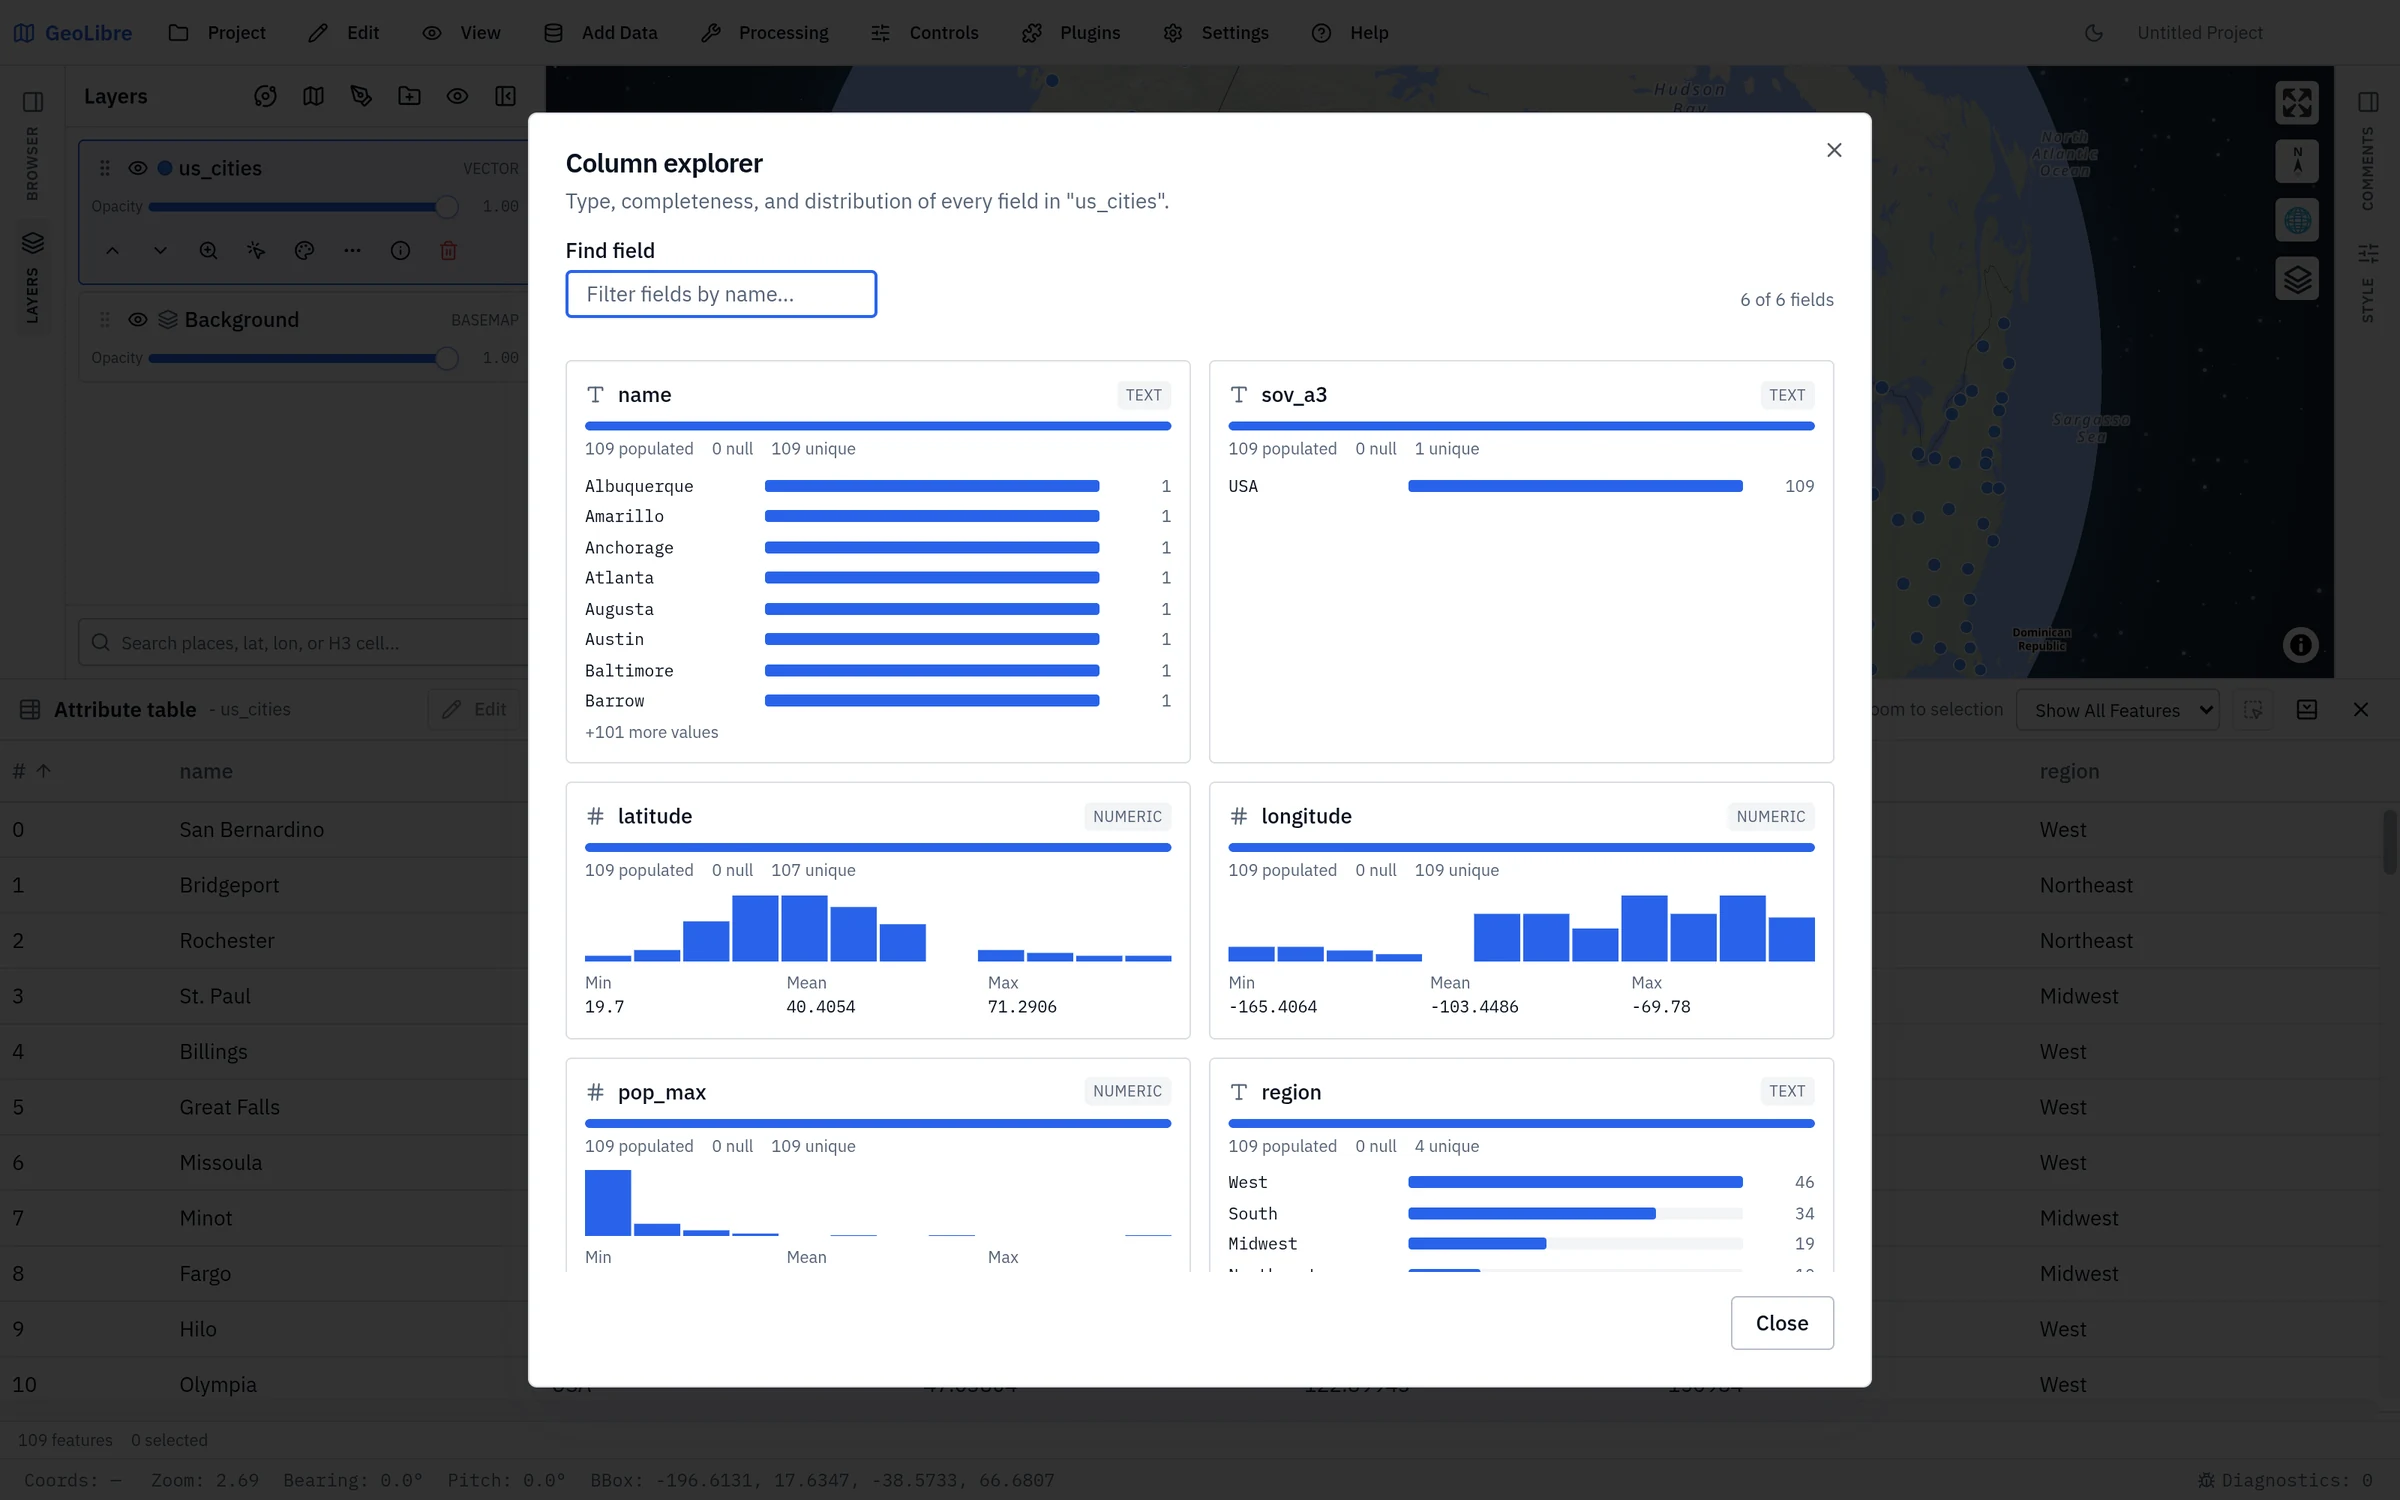
It is the fastest way to answer "what is actually in this data?" before styling or filtering it — a field that is 90% null, or a "numeric" field with one non-numeric outlier, shows up immediately.
Field statistics
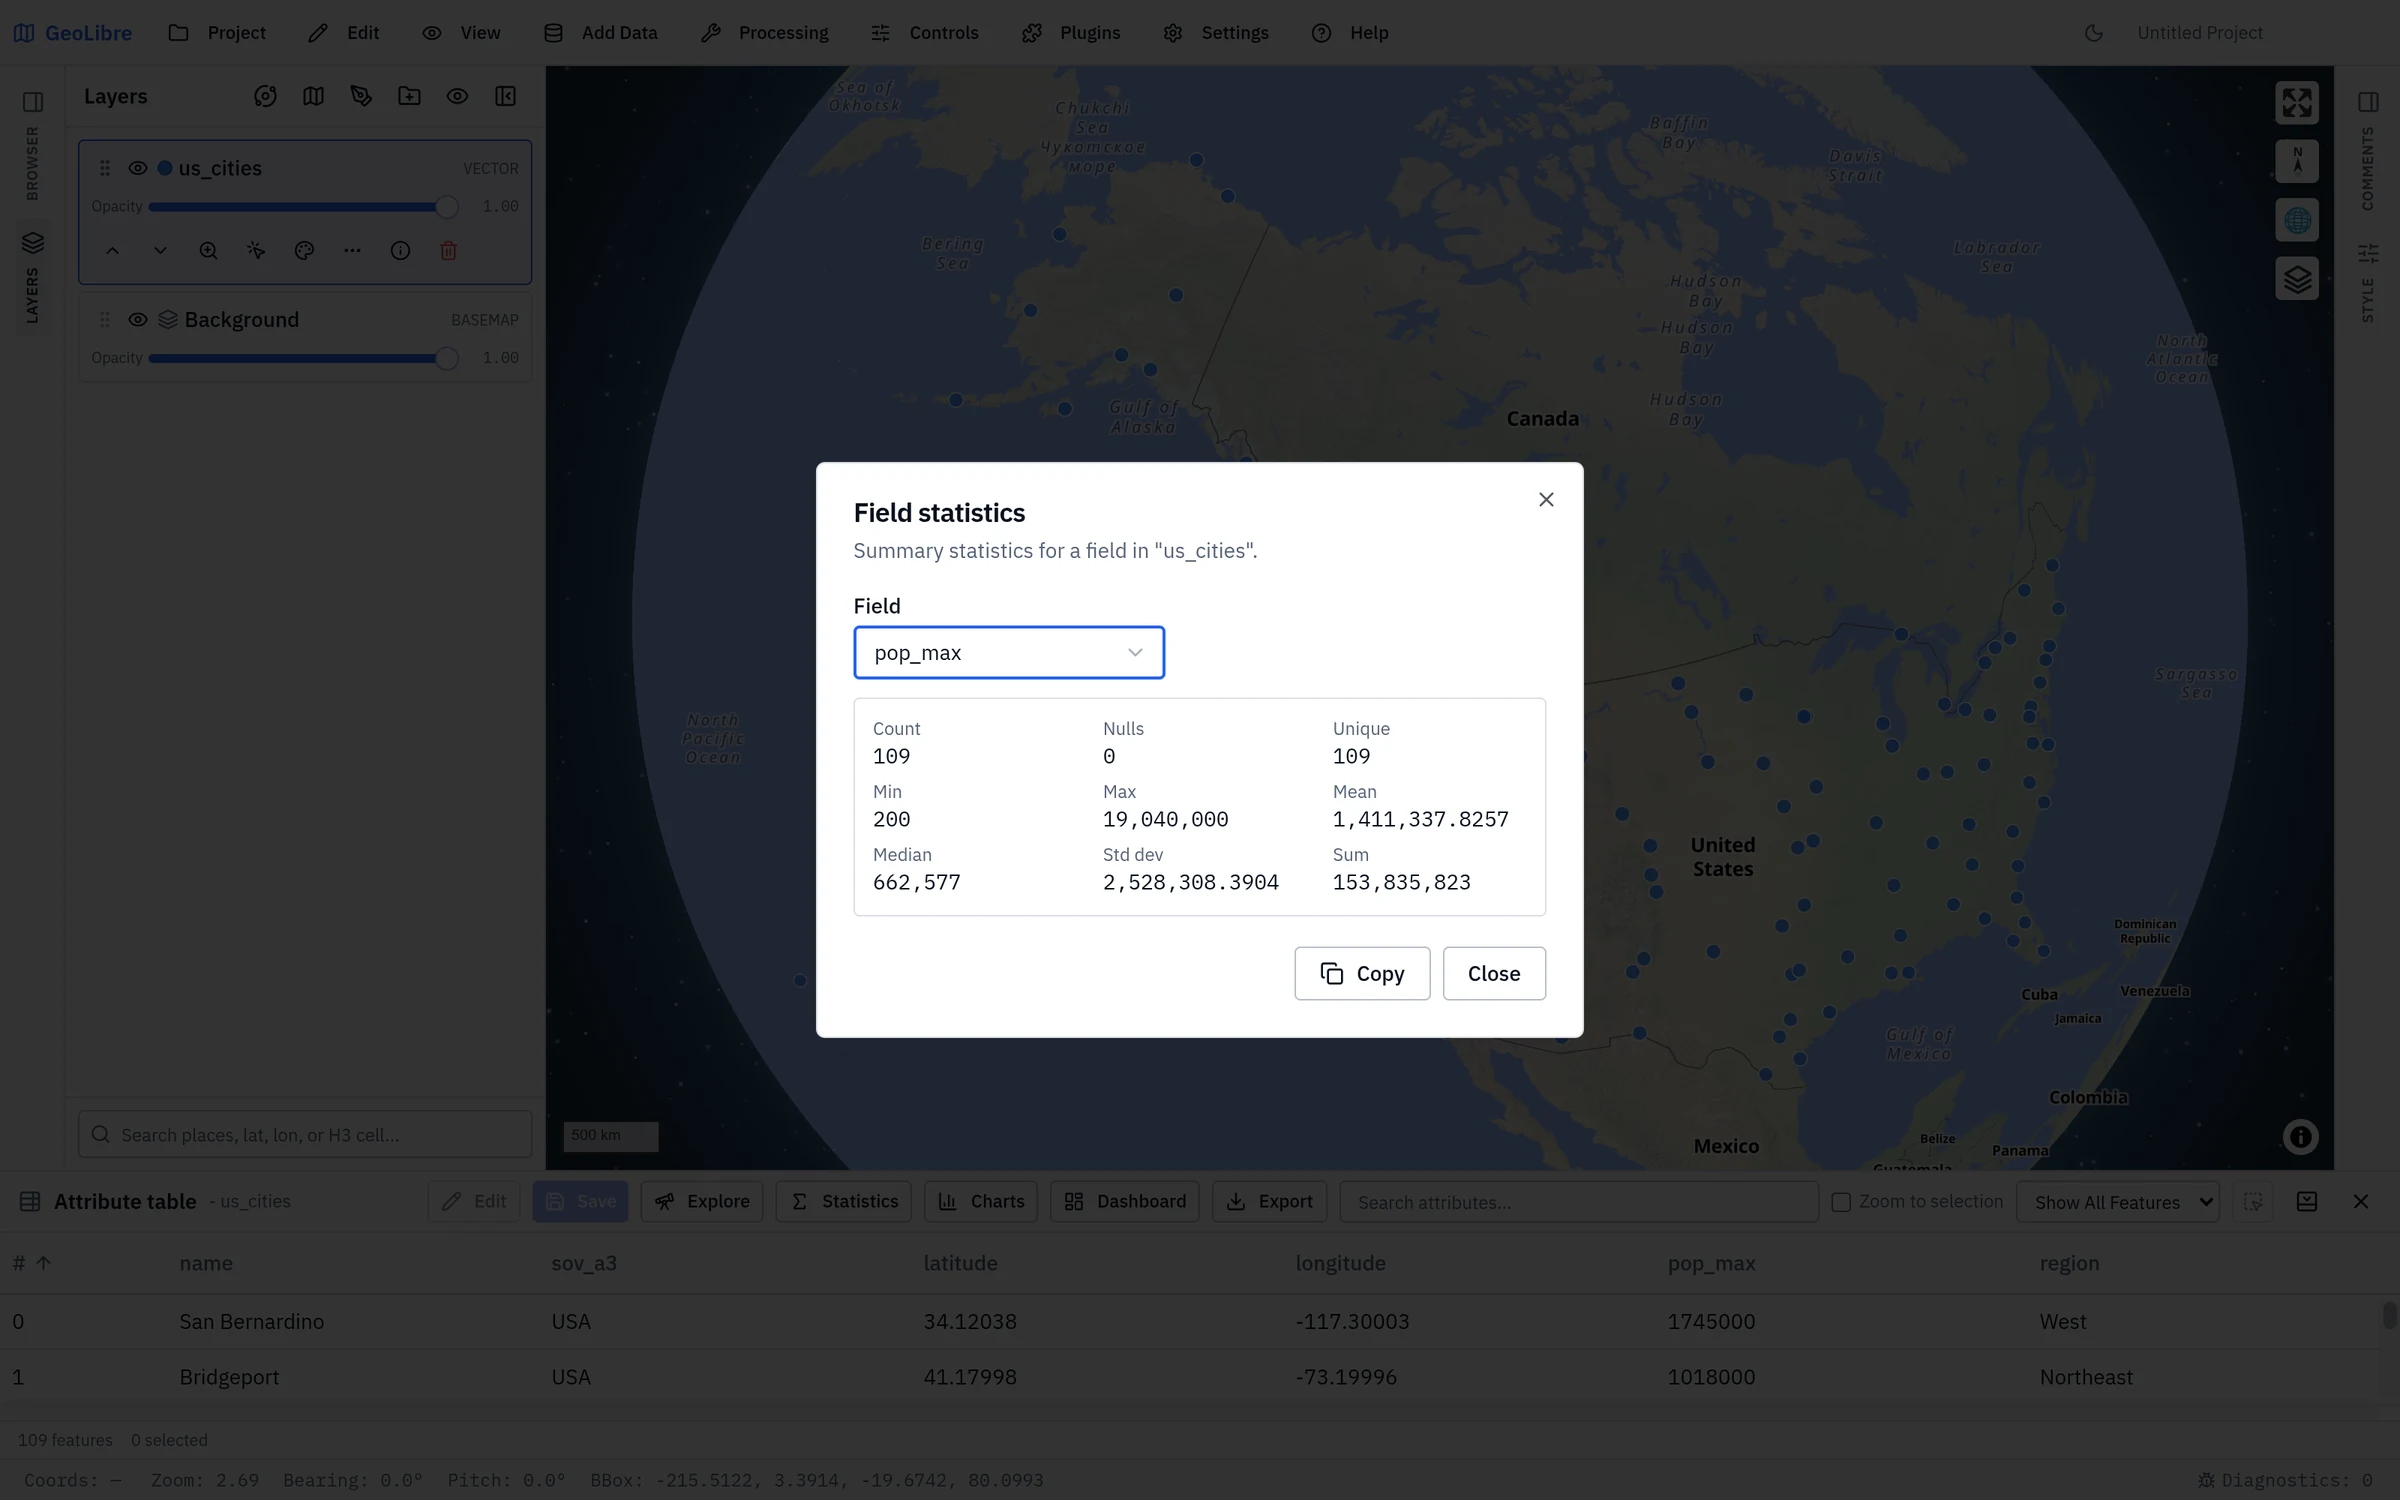
Statistics summarizes one Field over a Scope of all, filtered, or selected features. Every field reports Count, Nulls, and Unique; a numeric field adds Non-numeric, Min, Max, Mean, Median, Std dev, and Sum, while a text field lists its five most frequent values with their counts. Copy puts the whole summary on the clipboard.
Charts
Charts plots the layer without adding anything to the project:
| Chart | Options |
|---|---|
| Histogram | A number field and Bins (1 to 50). |
| Scatter | An X axis and Y axis field; up to 2,000 points. |
| Bar | A Category and an Aggregate (Count, Sum, or Average); up to 20 bars. |
| Line | A number field against row order. |
| Box plot | A number field. |
| Pie | A Category and an Aggregate (Count or Sum); up to 8 slices, the rest grouped as "(other)". |
Charts use all features. Download saves the chart as a PNG image or an SVG.
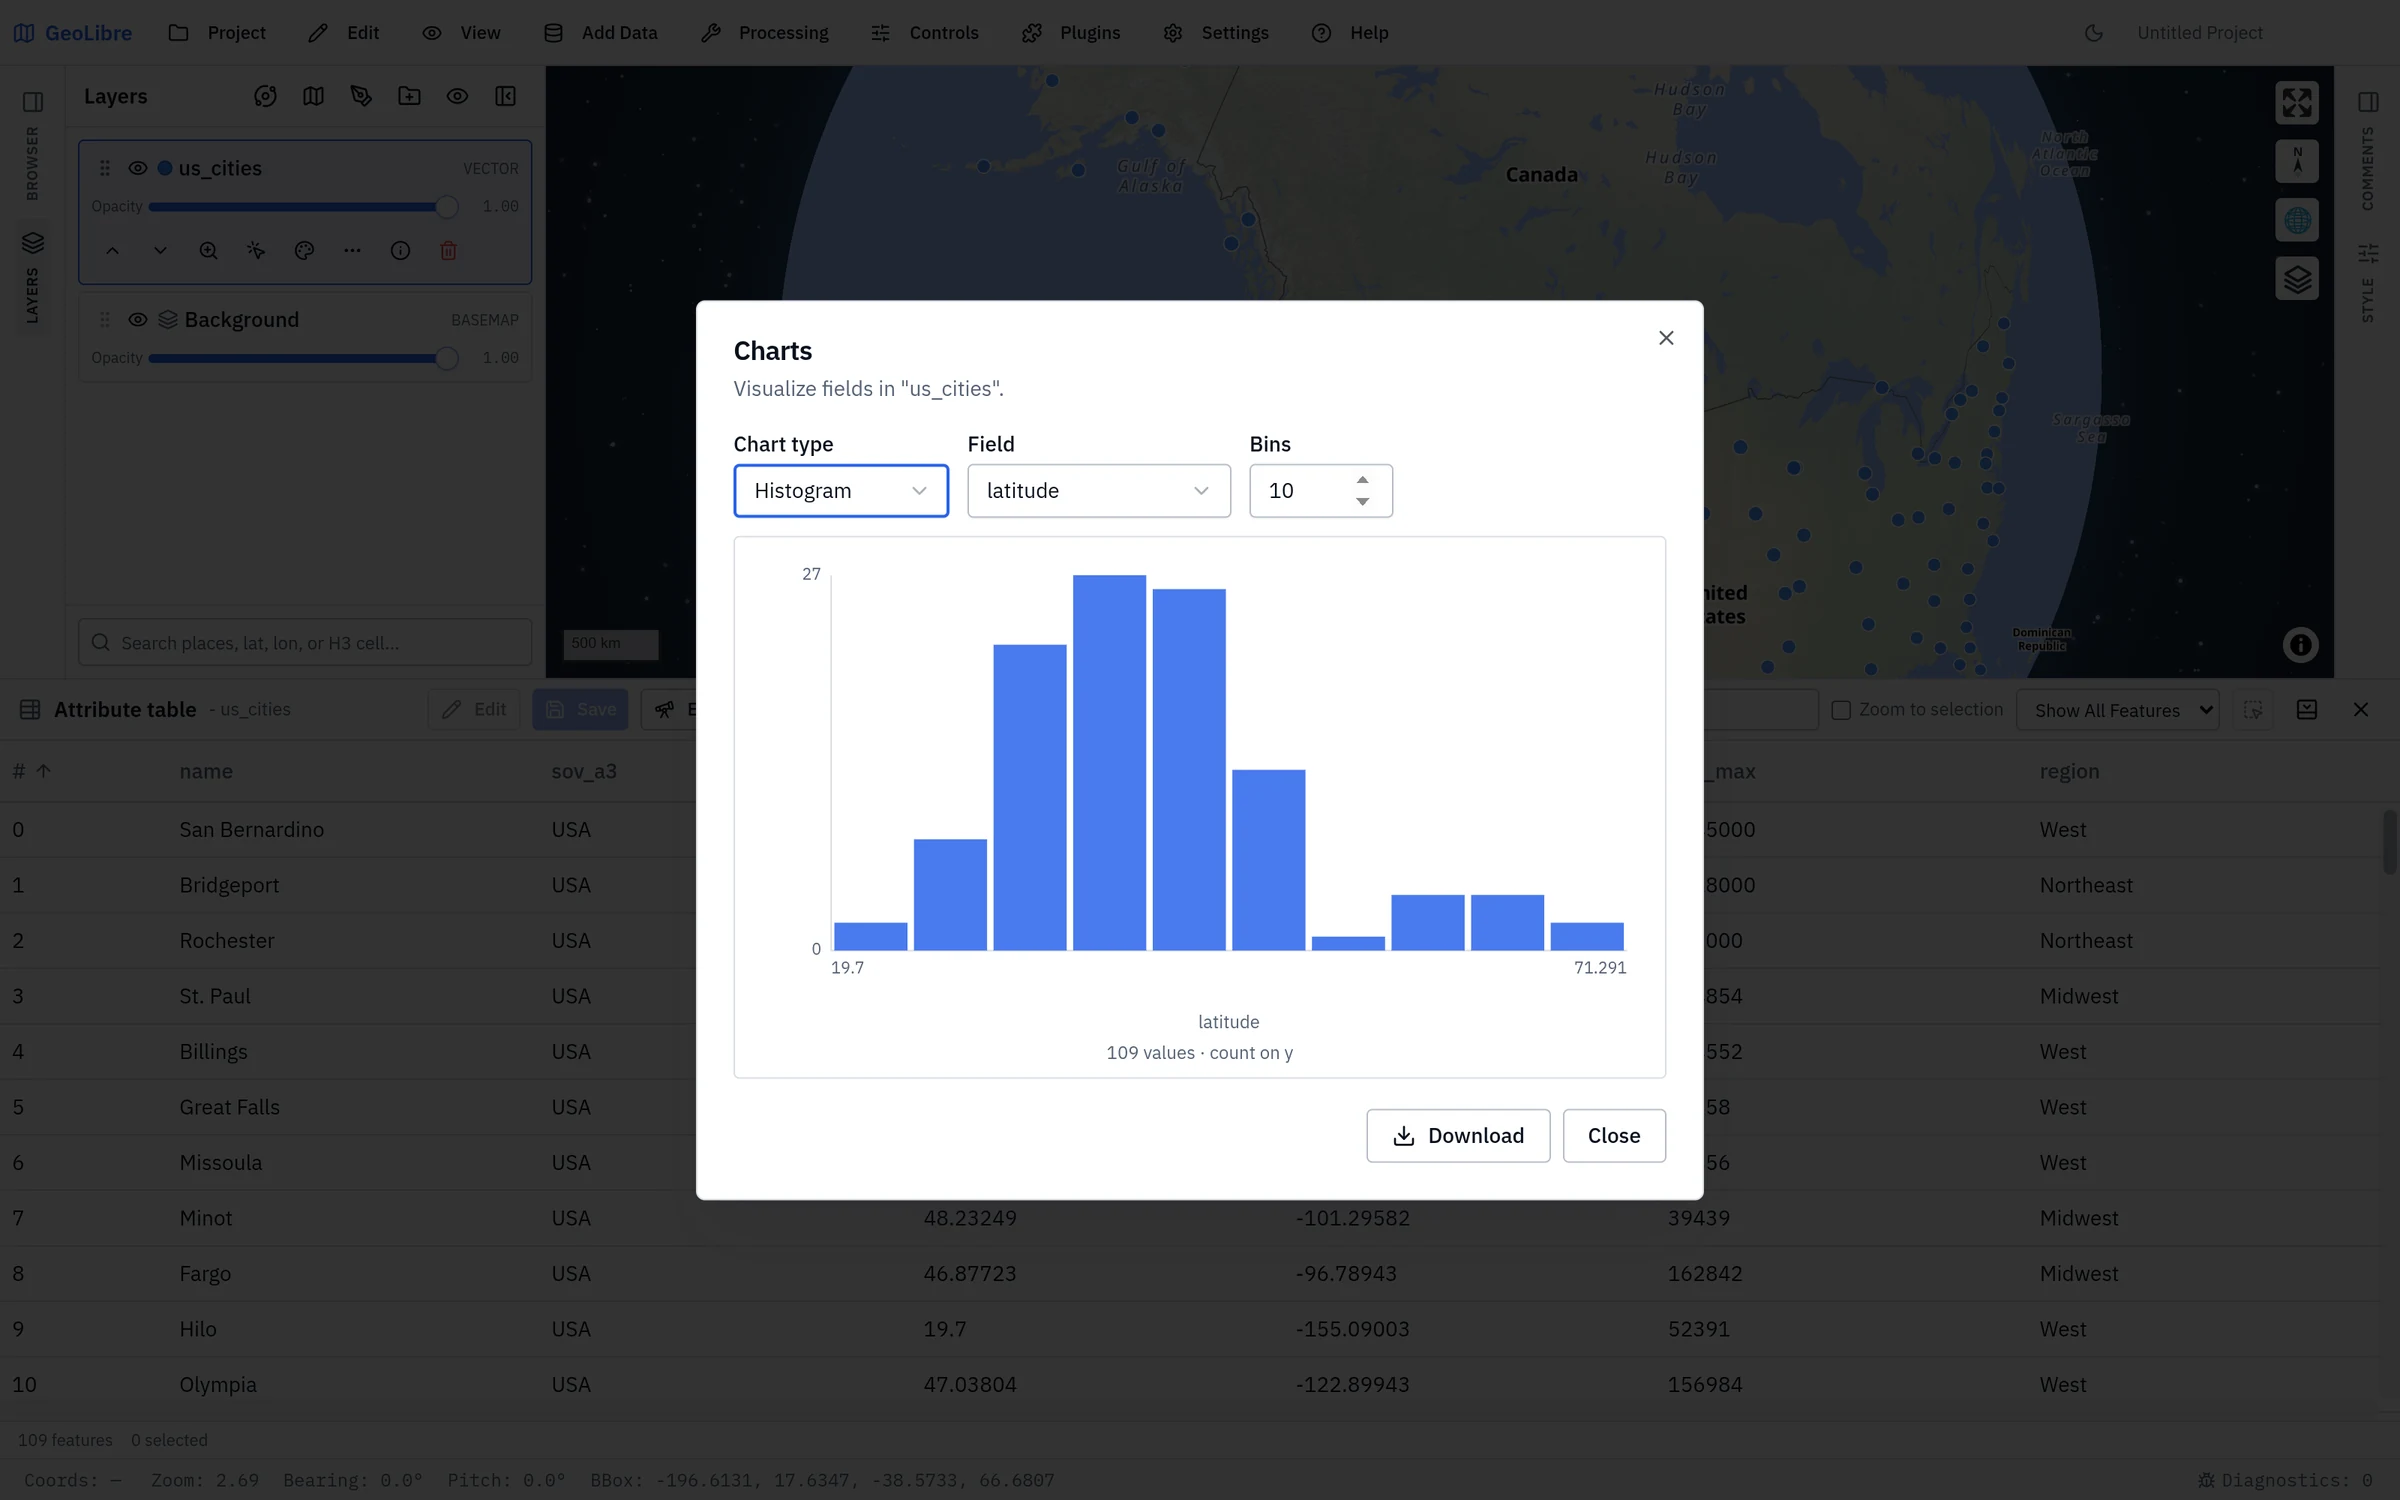
Charts here are throwaway views. For charts that are saved with the project and cross-filter each other, build them in the Dashboard instead.
Editing values
Click Edit to turn the cells into inputs. Changed cells are highlighted; Save commits them and the reset button discards every unsaved edit. A cell that holds an object must contain valid JSON before you can save.
- Joined, virtual, and editor-tracking fields are read-only.
- Edit is unavailable while you are editing geometry, and for Add Vector Layer layers.
Ctrl/Cmd+Zundoes saved layer changes (not while you are typing in a cell).- To write edits back to the file, service, or database the layer came from, use the layer's Save edits to source file (or the ArcGIS, PostGIS, and SQL Server equivalents).
Combine this with the GeoEditor plugin to edit geometry and attributes together. See Managing Layers.
DuckDB layers
Layers produced by the SQL Workspace or added from a DuckDB source behave like vector layers here, with identify, selection, sorting, search, statistics, and charts. Edits change only the rows held in memory, and Add field, Calculate, Fields, the column menus, attribute forms, and Export are not available for them. Export a DuckDB result from the SQL Workspace instead.
Exporting
Export writes the layer, including unsaved edits, as GeoJSON, GeoParquet, GeoPackage, KML, KMZ, a zipped Shapefile, or CSV (attributes only). Line layers also export as an encoded polyline (precision 5 or 6). Fields marked Exclude field on export are left out, and a Shapefile export warns when field names are cut to the format's 10-character limit.
The same formats are available from Layer actions → Export in the Layers panel. The SQL Workspace exports query results as CSV or GeoParquet, and the Conversion tools write cloud-native formats.