Adding Data
The Add Data menu is the main way to bring layers into GeoLibre. It groups sources into Files, Web services, Cloud formats, 3D layers, and Databases. You can also drag files straight onto the map.
For a consolidated list of file formats, service protocols, and platform limitations, see Supported Data Formats.
To collect supported dataset links from a catalog or other webpage and open several at once, use the GeoLibre Chrome extension, available from the Chrome Web Store.
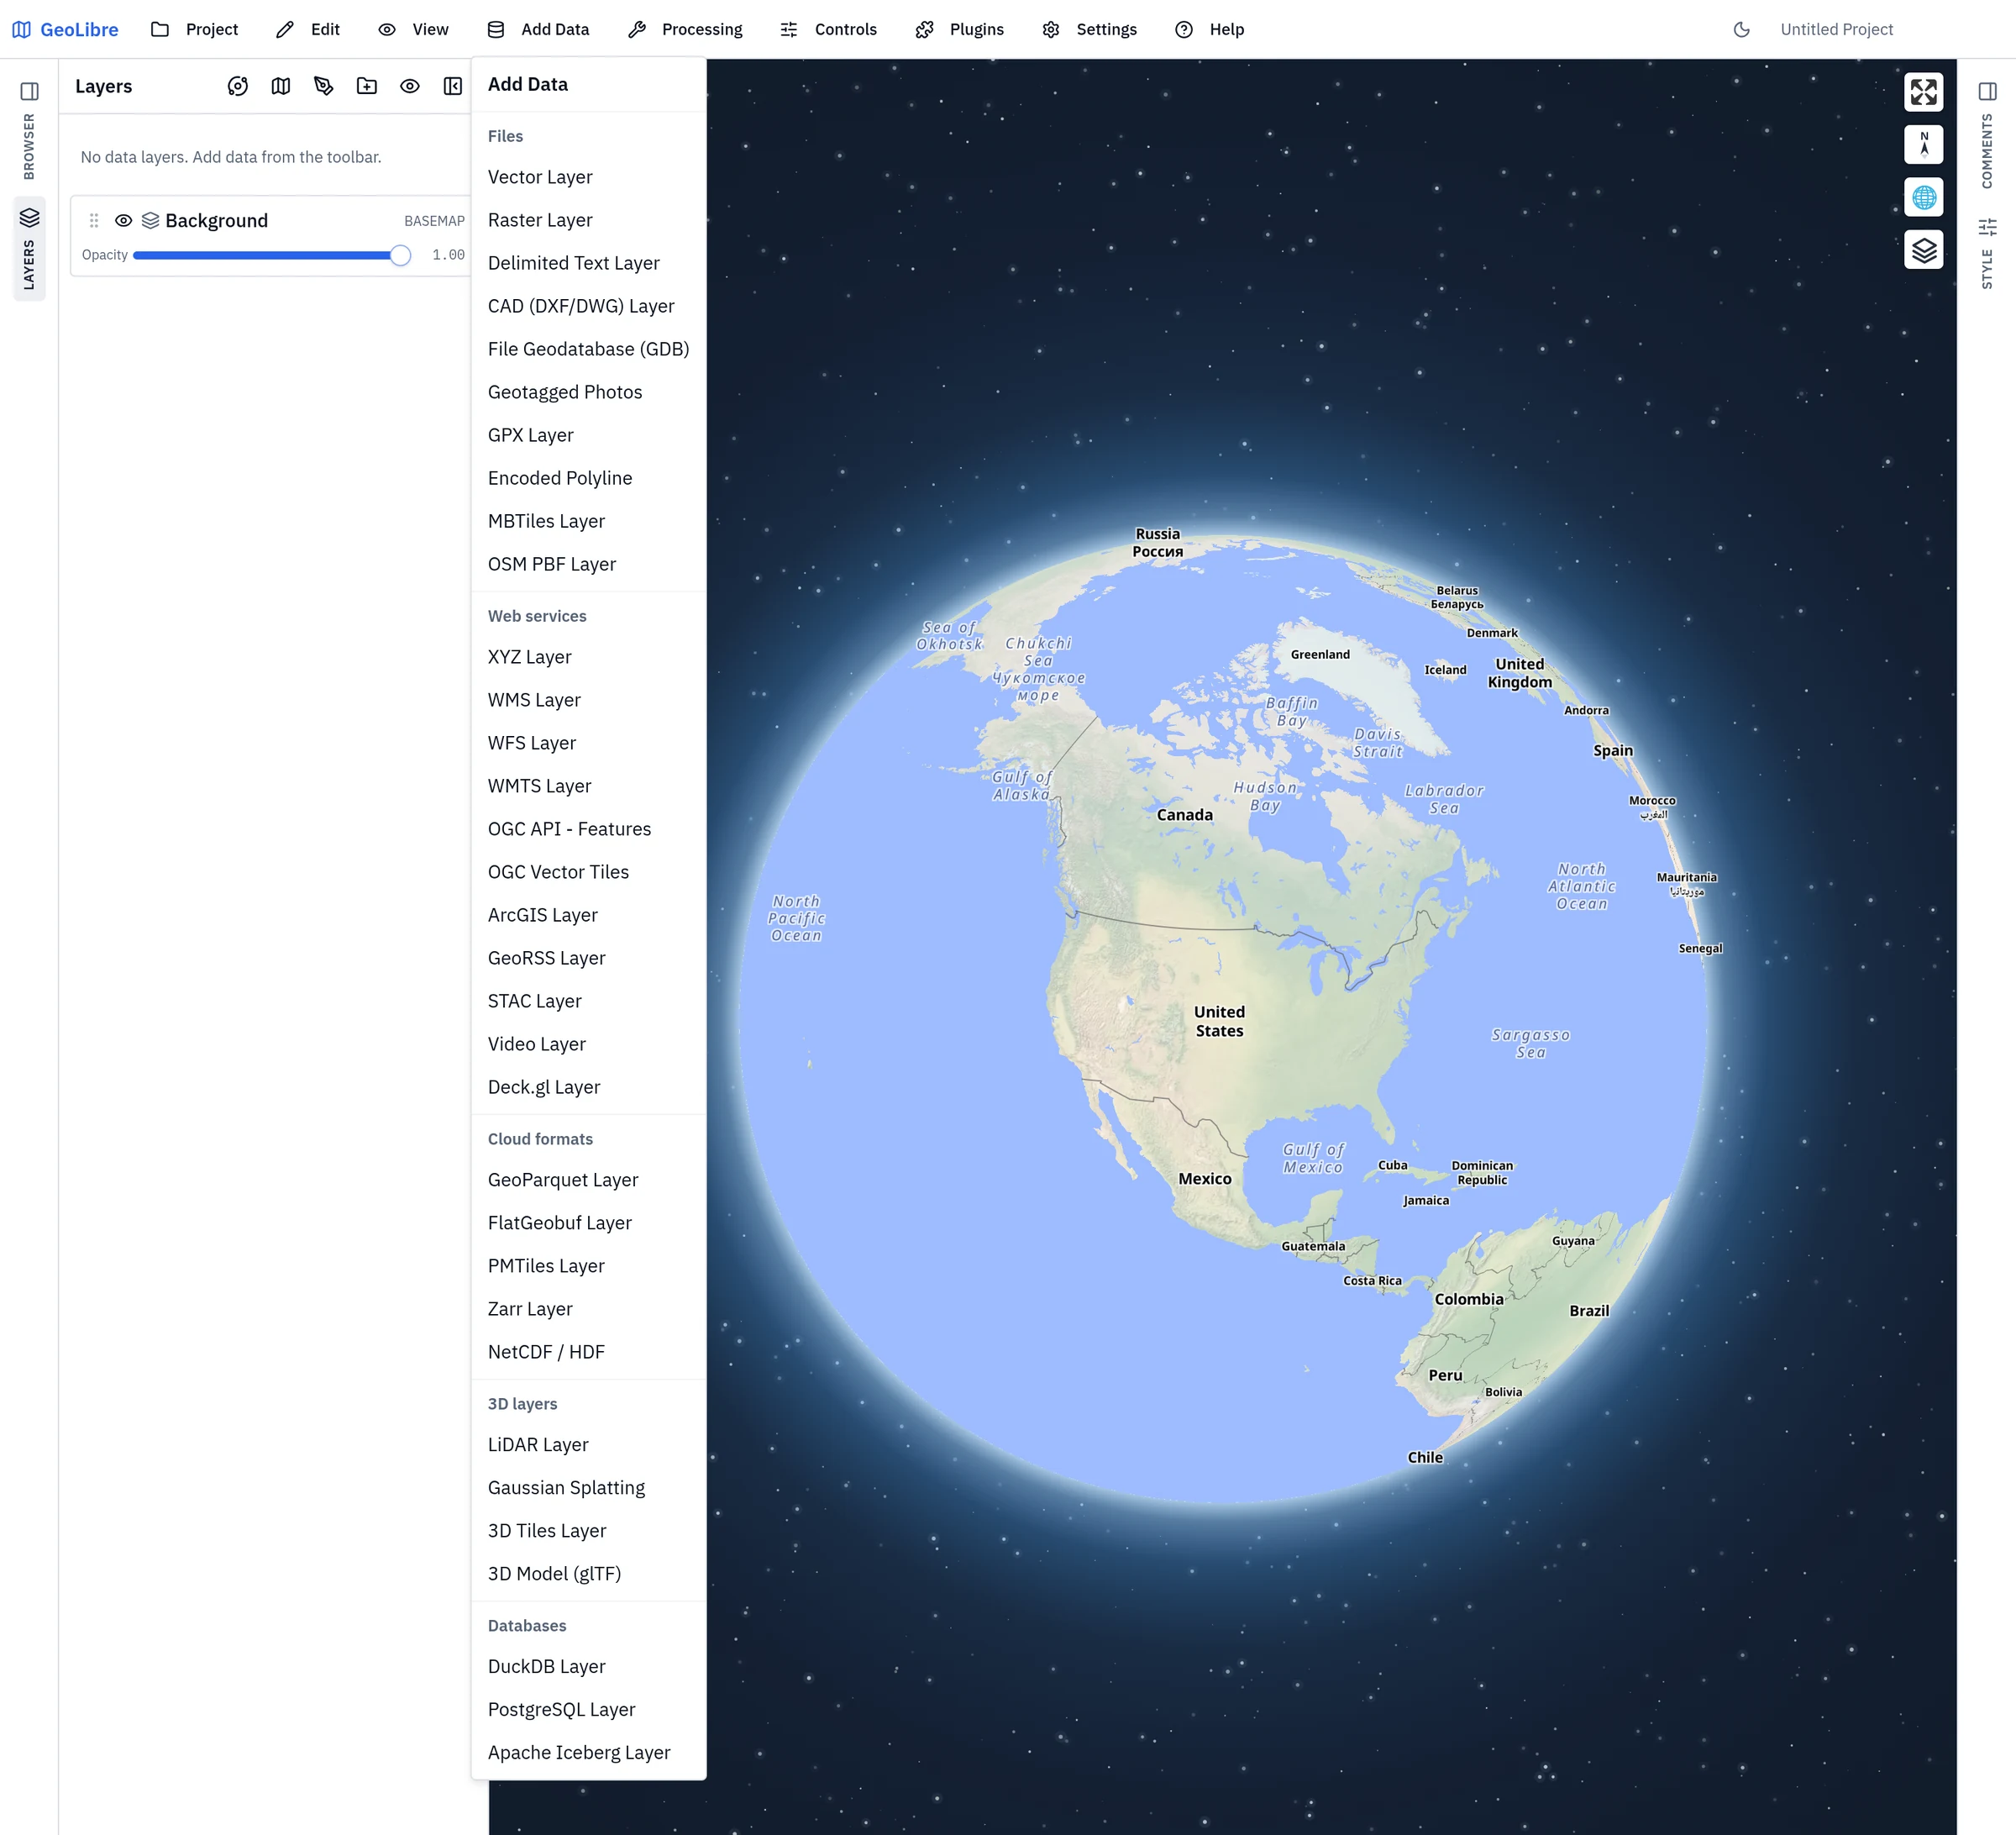
Files
| Item | Notes |
|---|---|
| Vector Layer | Opens the Add Vector panel (backed by maplibre-gl-vector). Loads GeoJSON, GeoParquet, FlatGeobuf, zipped Shapefile, GeoPackage, KML/KMZ, GML, and other vector formats from a file or URL. |
| Raster Layer | Opens the Add Raster panel (backed by maplibre-gl-raster). Loads GeoTIFF and Cloud-Optimized GeoTIFF (COG) from a file or URL. |
| Delimited Text Layer | Loads CSV/TSV from a file or URL, using longitude and latitude columns to build point features, or by geocoding one or more address columns (see Geocoding). A file with no coordinates can be added as a non-spatial attribute table. |
| CAD (DXF/DWG) Layer | Loads AutoCAD drawings, converting their entities to vector features. Coordinate Z values (contours, 3D polylines, surveyed points) are kept and rendered in 3D unless Render Z values in 3D is unchecked. |
| File Geodatabase (GDB) | Opens an Esri file geodatabase (.gdb folder) and adds one of its feature classes as a layer. It is read by the local GeoLibre server, so it needs the desktop app. |
| Geotagged Photos | Reads the EXIF GPS tags from a set of photos and places each one on the map as a point with a thumbnail. |
| GPX Layer | Loads a GPX file or URL and splits it into separate waypoint, track, and route layers. |
| LandXML Layer | Loads a LandXML file or URL and imports selected TIN surfaces, horizontal alignments, vertical profile metadata, and survey points. Projected coordinates are reprojected from the selected or embedded source CRS. |
| Encoded Polyline | Loads Google (precision 5) or Valhalla/Mapbox (precision 6) encoded polyline strings from pasted text or uploaded text files. |
| MBTiles Layer | Loads a local MBTiles tile archive (desktop app). |
| OSM PBF Layer | Reads an OpenStreetMap .osm.pbf extract and adds the features you select from it. |
| ICESat-2 / GEDI | Spaceborne LiDAR footprints from an ICESat-2 (ATL06, ATL08) or GEDI (L2A, L2B, L4A) HDF5 granule, or ICESat-2 ATL03 photons (read from the file on demand for the current map view, so multi-gigabyte granules need no download into memory; pick the surface, the lowest signal confidence and a photon cap), from a local file or the sample granules on Source Cooperative (or found and downloaded with NASA Earthaccess), added as a point layer colored by the product's main field. Open Layer actions → Along-track profile for distance along a beam against ground and canopy top (ICESat-2 ATL08, GEDI L2A/L2B) or any field; it is linked to the map, so hovering marks the footprint and clicking selects it. |
A layer the Add Vector panel loads in GeoJSON mode, with up to 100,000 features, is handed over to GeoLibre once it has loaded, so it gets the same Style panel as a file dropped on the map: joins, virtual fields, the attribute form, popup design, editor tracking, diagrams, and geometry generators included. It then leaves the panel's own layer list and is managed from the Layers panel. The panel keeps the layers it draws as tiles, streamed GeoParquet, larger layers, and KML/KMZ layers with placemark icons; for those, the Style panel shows only the settings the panel can draw. A saved project still reopens a handed-over layer from its URL or file path, and a URL-backed one refreshes the same way.
Vector files are reprojected to EPSG:4326 on load. In the browser, vector import relies on DuckDB-WASM Spatial, with direct handling for GeoJSON, zipped Shapefiles, and KMZ archives. The source CRS is read from the file itself — the layer metadata for the GDAL-read formats, a Shapefile's .prj sidecar, or a GeoParquet's geo metadata — so a national grid such as EPSG:2100 (GGRS87 / Greek Grid) lands in the right place with nothing to configure.
GeoParquet opens across its variants: 1.0 and 1.1 files (including one carrying a declared covering bbox column), 2.0 files using the native Parquet GEOMETRY/GEOGRAPHY types, and plain Parquet whose geometry is only a WKB blob under a conventional name such as geom. The geo metadata block decides which column holds the geometry and what CRS it is in, so a file with several geometry columns loads the one it declares as primary; a file declaring "crs": null is stating that its coordinates are in no known reference system, and is drawn as it stands with no transform applied. A Parquet table with no geometry at all but a pair of lon/lat (or longitude/latitude, lng, x/y) floating-point columns loads as points, assumed to be WGS84.
Large vector files
There is no fixed size limit. Files under 100 MB are read by the
in-memory JavaScript readers, which are fastest for everyday data. At
100 MB or larger, GeoLibre streams the file through DuckDB instead —
off the main thread, so the interface keeps responding. For a zipped
Shapefile the threshold applies to the uncompressed .shp, since
shapefiles compress heavily and the archive's size says little about the
parse cost. This happens automatically; nothing is asked of you.
A separate check counts features once the source is open. Past 100,000 features, GeoLibre asks before converting every one to GeoJSON in memory, because that is where memory rather than file size becomes the limit — a small GeoParquet can hold millions of rows.
For very large data, converting first still pays: Processing → GeoLibre Toolbox → Conversion → Vector to PMTiles writes a tiled format the map loads one tile at a time instead of reading the whole file. Converting to GeoParquet instead gives a compact columnar format that reads far faster than text, though it is not tiled. GeoJSON is the most expensive option at any size — it expands several-fold in memory — so prefer a Shapefile, GeoParquet, or FlatGeobuf source when you have the choice.
KML and KMZ
KML is read by an in-house parser that keeps the file's own symbology, so styled KML renders the way it does in Google Earth. A file that parser cannot handle falls back to the DuckDB Spatial reader, which loads the geometry without the styling.
KML imports also render GroundOverlay images as map overlays (which animate through the Time Slider when they are time-tagged) and show embedded Collada .dae models. Super-Overlays — the tiled, NetworkLink-driven KML that large imagery exports use — are supported too: GeoLibre serves the archive's tiles to the map instead of trying to load the whole pyramid at once.
Web services
| Item | Notes |
|---|---|
| XYZ Layer | A raster or vector tile service using a {z}/{x}/{y} URL template. |
| WCS Layer | Downloads numerical GeoTIFF subsets from WCS 1.0.0 services. |
| WMS Layer | A Web Map Service layer, with click-to-identify through GetFeatureInfo where supported. In the desktop app, once the layers are retrieved, a layer can be requested in any coordinate reference system it offers; the tiles are reprojected to Web Mercator. |
| CSW Catalog | Searches an OGC Catalogue Service (CSW) for datasets and adds their supported linked resources (GeoJSON, WMS, WFS, ArcGIS) to the map. |
| WFS Layer | A Web Feature Service layer, with optional automatic refresh. GeoLibre asks for GeoJSON first and falls back to GML when the server offers no GeoJSON output, so GML-only services (MapServer, most INSPIRE services) load too. GML in WGS84, ETRS89, NAD83 or Web Mercator is read directly, and GML in any other EPSG coordinate system (a national grid, a UTM zone) is reprojected; a system GeoLibre does not know is reported as an error rather than drawn in the wrong place. In the desktop app, WFS requests go through the native HTTP client, so services that send no CORS headers load too. |
| WMTS Layer | A Web Map Tile Service layer. |
| OGC API - Features | An OGC API - Features endpoint; pick a collection and add it as a vector layer. |
| OGC Vector Tiles | An OGC API - Tiles vector tile service. |
| ArcGIS Layer | An ArcGIS FeatureServer, VectorTileServer, MapServer, or ImageServer layer. See ArcGIS services. |
| GeoRSS Layer | A GeoRSS feed, added as points and lines with the feed's titles and descriptions as attributes. |
| Administrative Boundaries | Pick a country and an admin level (ADM0 for the national border down to ADM3 to ADM5 where a country has them) to add its geoBoundaries polygons. Simplified geometry is the default; clear it for full-resolution boundaries, which can be several MB. |
| STAC Layer | Searches a STAC catalog and adds the matching raster items. |
| Video Layer | Drapes a video over four map corner coordinates, the way MapLibre's video source does. |
| Deck.gl Layer | Renders a deck.gl layer specification over the map, for visualizations MapLibre's own layer types do not cover. |
ArcGIS services
Pick the Layer type that matches the service, then give it a service URL or a portal item ID. For a secured service, set Authentication to Sign in with ArcGIS or paste an access token; see Signing in with ArcGIS.
| Layer type | Service | How it loads |
|---|---|---|
| Feature layer | FeatureServer | Downloaded page by page as a GeoJSON layer, so labels, the attribute table, identify, symbology, and export all work on it. |
| Vector tile layer | VectorTileServer | Rendered from the service's own style. |
| Map service | MapServer | A raster layer. Cached services are read as tiles; dynamic ones are drawn per tile through /export. |
| Image service | ImageServer | A raster layer drawn through /exportImage (or the service's tile cache). |
Map and image services become ordinary raster layers, so opacity, the Style panel's brightness/contrast/saturation controls, reordering, and saving to a project all work on them.
Two optional fields shape what the service draws:
- Sublayers (map service) takes the sublayer ids to draw, such as
0,2,5. Leave it blank for the service's own default set. Pasting a URL that ends in a sublayer id (.../MapServer/3) selects that sublayer for you. - Raster function (image service) can be selected from the functions the
service advertises with Browse functions. The selected function is applied
by the server before the image is sent. The Rendering rule field
remains available for advanced Esri raster function JSON. For example,
{"rasterFunction":"Hillshade"}selects the Hillshade function.
Either choice draws the service dynamically, because a cached service's tiles were rendered before the choice existed and cannot honor it.
Cloud formats
| Item | Notes |
|---|---|
| GeoParquet Layer | Cloud-native columnar vector format. Opens the same Add Vector panel as Vector Layer. Can be streamed in place with HTTP range requests for large remote files. |
| FlatGeobuf Layer | Cloud-optimized vector format with spatial indexing. |
| PMTiles Layer | A single-file vector or raster tile archive. |
| Zarr Layer | Chunked, cloud-native multidimensional arrays. |
| NetCDF / HDF | Multidimensional scientific data cubes, with a setup step for picking the variable and the time and vertical dimensions. |
3D layers
| Item | Notes |
|---|---|
| LiDAR Layer | Point-cloud visualization, rendered with deck.gl. |
| Gaussian Splatting | Gaussian splat scenes. |
| 3D Tiles Layer | OGC 3D Tiles, restored when reopening a project. Includes a Google Photorealistic 3D Tiles sample that reads VITE_GOOGLE_MAPS_API_KEY or GOOGLE_MAPS_API_KEY from the runtime environment. |
| Cesium Ion Asset | Adds a 3D Tiles tileset or imagery from Cesium ion by asset ID, using your Cesium ion token. Cesium engine only; the entry is disabled on the 2D engines. |
| CZML Dynamic 3D Scene | Loads a CZML document of orbits, trajectories, vehicle paths, and other time-varying 3D scenes. Cesium engine only. |
| KML / KMZ | Loads KML or KMZ with native globe styling, overlays, and network links on the Cesium globe, and through the regular KML importer on the 2D engines. |
| 3D Model (glTF) | Places a glTF/GLB model at a coordinate, with scale, rotation, and altitude controls. |
Databases
| Item | Notes |
|---|---|
| DuckDB Layer | Query a DuckDB or DuckDB Spatial source and add the result as a layer, with identify, selection, and attribute table support. |
| PostgreSQL Layer | Add a layer from a PostgreSQL/PostGIS connection (desktop app, served through a local tile server). |
| SQL Server Layer | Add a spatial table from SQL Server or Azure SQL (desktop app). |
| Apache Iceberg Layer | Read an Iceberg table through DuckDB and add its spatial column as a layer. |
Drag and drop
Drag a vector file (GeoJSON, zipped Shapefile, KMZ, and similar) or a GeoTIFF/COG raster directly onto the map to add it as a layer. GPX files dropped on the map are split into named waypoint, track, and route layers. Other files are routed by type:
- OSM PBF (
.osm.pbf) extracts are parsed into point, line, and polygon layers. - LAS, LAZ, and COPC point clouds load into the LiDAR control; a LAS 1.4 file the viewer cannot read whole is converted to COPC first.
- Geotagged photos (JPEG, PNG, WebP, HEIC) become a point layer placed from their EXIF GPS tags.
- A single
.geolibre.jsonproject file opens as the current project.
The Browser panel
The Browser tab on the left edge of the window opens a QGIS-style Data Source Manager: a tree of everything you can add without going through a menu. Use it when you add the same sources repeatedly, or when you want to explore a service or a database before committing to a layer.
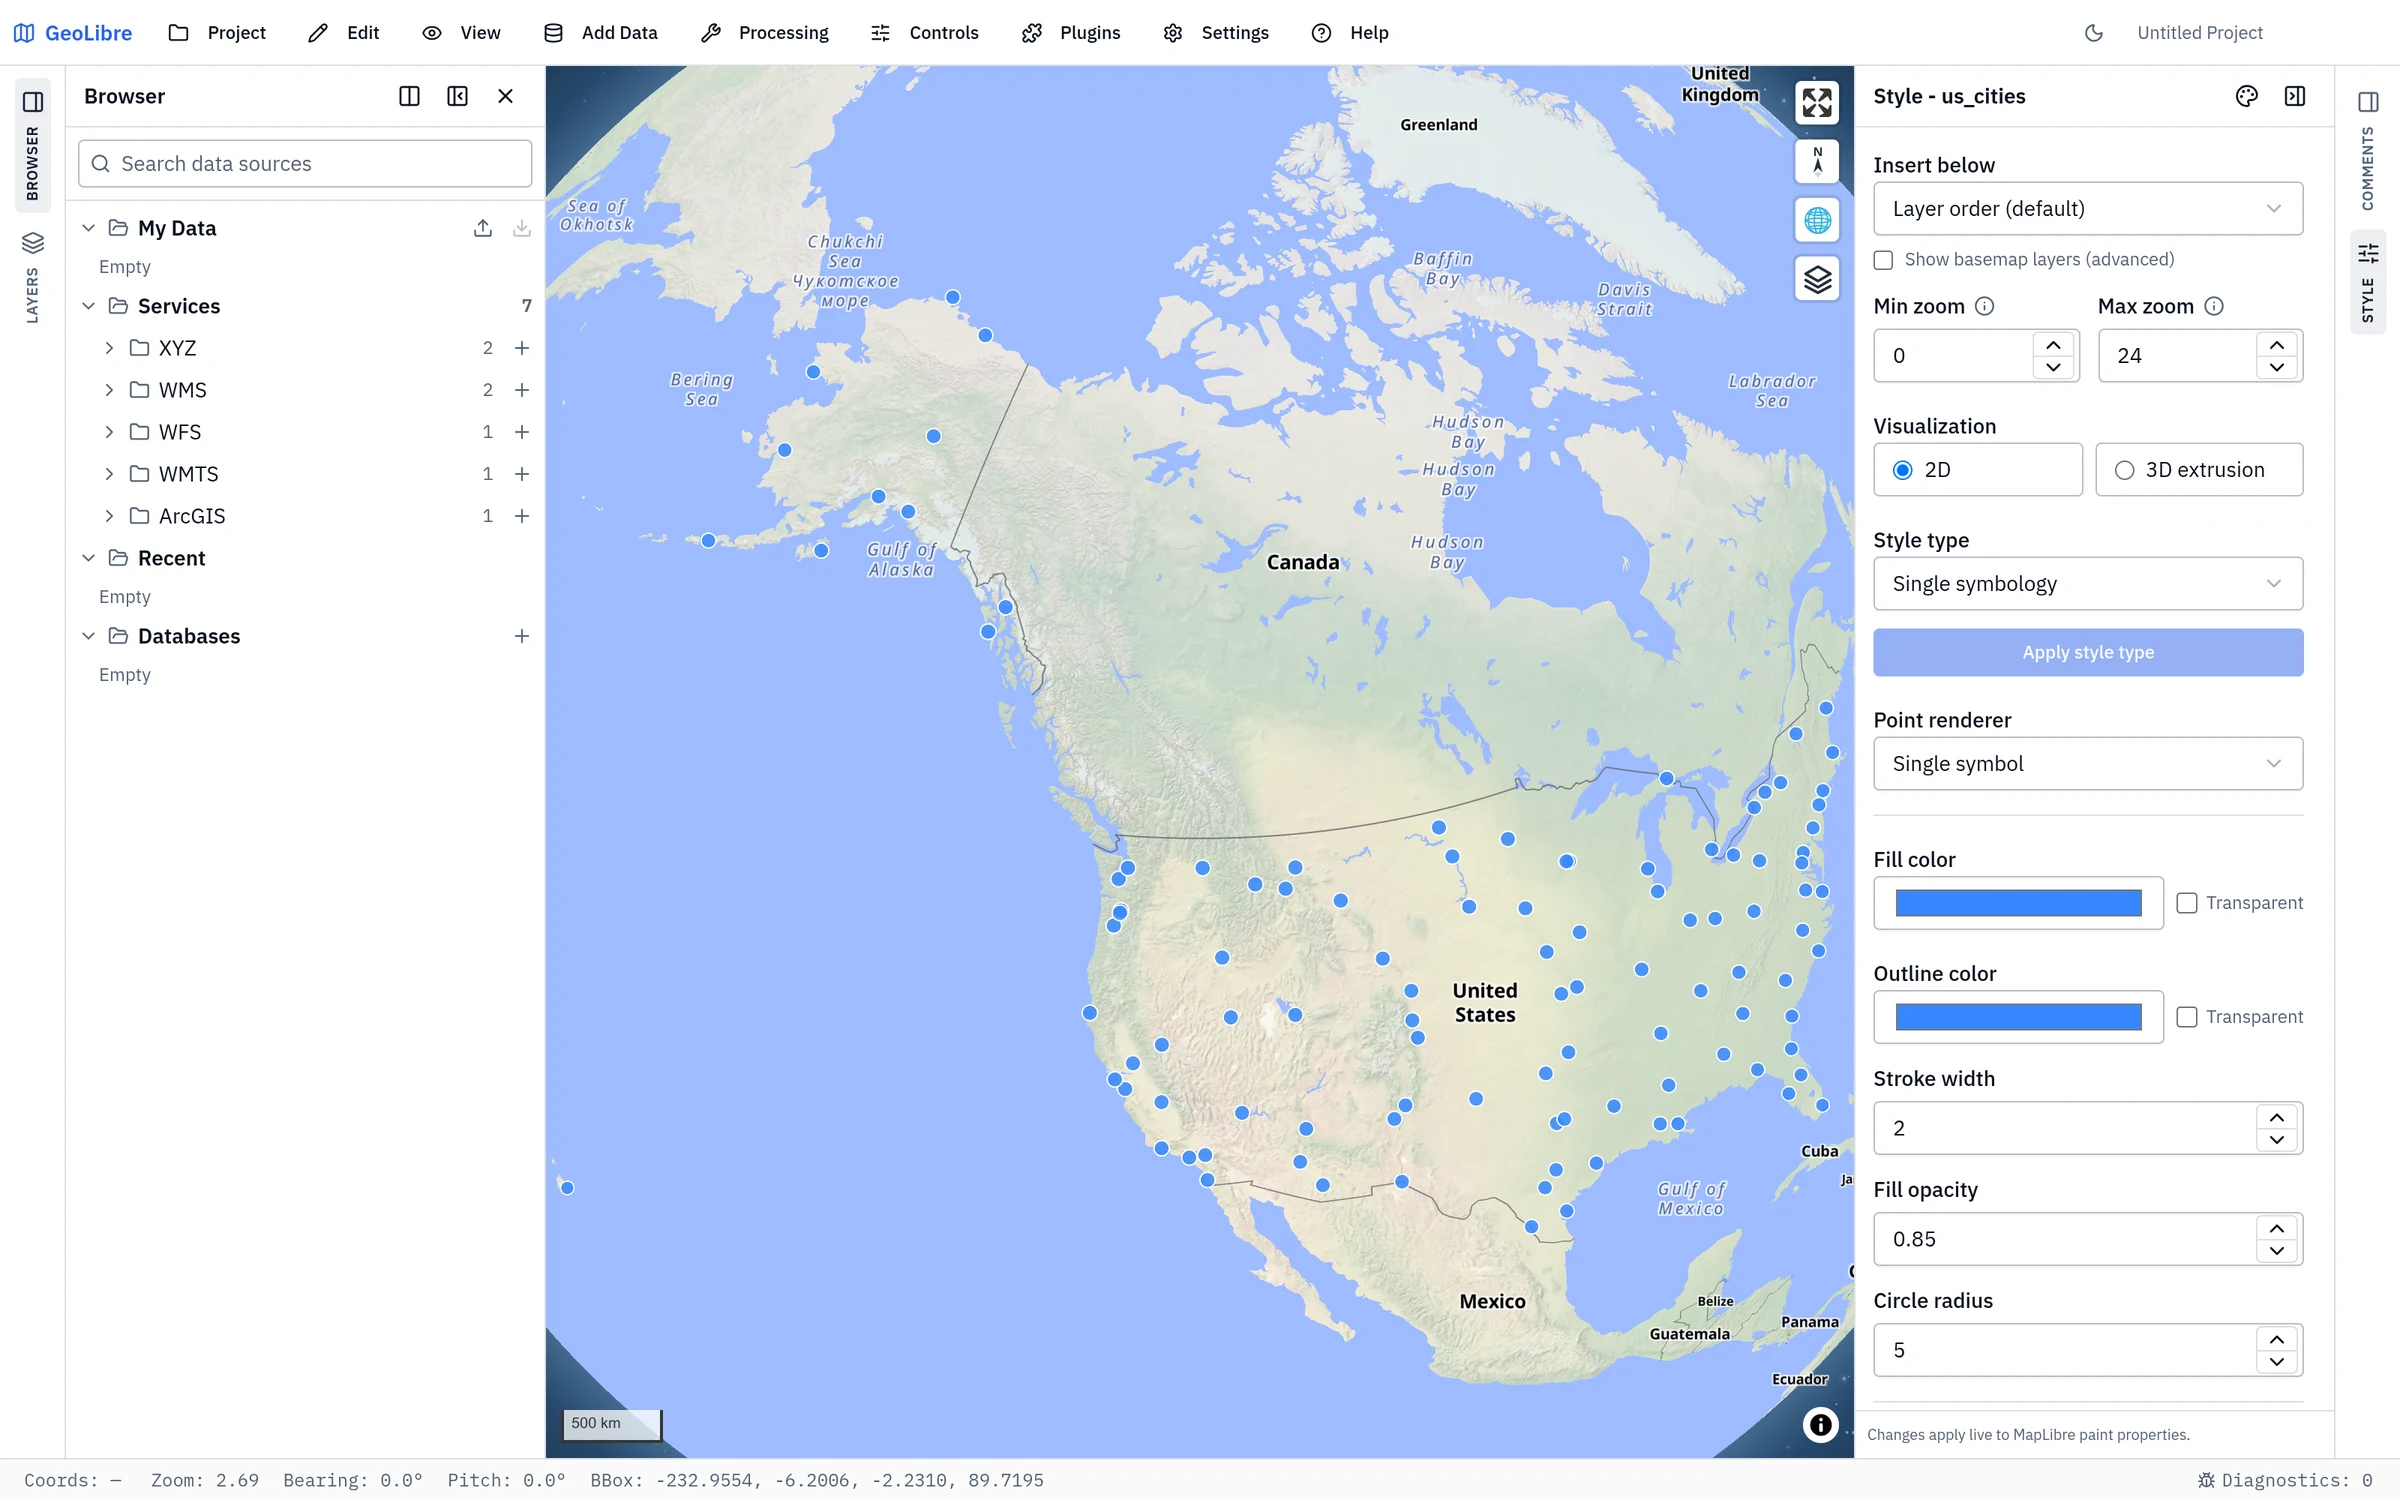
| Section | What it holds |
|---|---|
| Favorites | Services, folders, and files you starred, listed first for quick access. Appears once you have favorited something. |
| My Data | Your personal layer library. Layer actions → Save to My Data stores a fully configured layer — source, style, labels, filters, joins, virtual fields, and attribute form — and one click here re-adds it to any later project. Import and export the library with the buttons on the section header. |
| Services | Saved map services, grouped by kind (WMS, WFS, WMTS, XYZ, ArcGIS, CSW). GeoLibre ships a starter set; the + on a group adds a new connection of that kind. Expand a service to browse its layers and add one. Self-hosted deployments can add read-only organization-wide services here, marked with a config badge (see Getting Started); they are shared with every user, cannot be edited or deleted, and are never stored in your own service library. |
| Recent | The projects you opened most recently, so reopening one is one click. |
| Databases | PostgreSQL/PostGIS and SQL Server connections, each in its own engine group with a + for a new connection. Expand a connection to browse its schemas and spatial tables; the Add Data form retains each engine's table options. The trash icon forgets a saved connection and removes its saved credential; on desktop, if the system keychain cannot delete the credential right away, GeoLibre shows a persistent warning with the password-masked connection label and retries the next time it starts. Failures for different connections are reported separately. |
| Files | Desktop app only. Folders you pinned with Add folder (the + on the section), each expandable to its subfolders and the loadable files inside, so you can add a file without a file dialog. |
Choose the + on the PostgreSQL or SQL Server group to open that engine's connection form; the Databases section has no shared connection action.
Forgetting a PostgreSQL connection invalidates table requests already in flight, so re-saving it cannot show an older request's table list. On desktop, an unreadable or malformed credential-deletion journal prevents forgetting additional connections until the journal can be read and is valid again; GeoLibre preserves it rather than discarding pending deletions. A connection's deletion result reflects the system keychain's acknowledgement, even if the journal becomes unreadable after the saved-list update.
Type in the search box to filter the whole tree, and navigate it entirely from the keyboard with the arrow keys.
If desktop database browsing reports a processing server from a previous session, quit any stray GeoLibre processes, then collapse and re-expand the connection to retry.
Basemaps
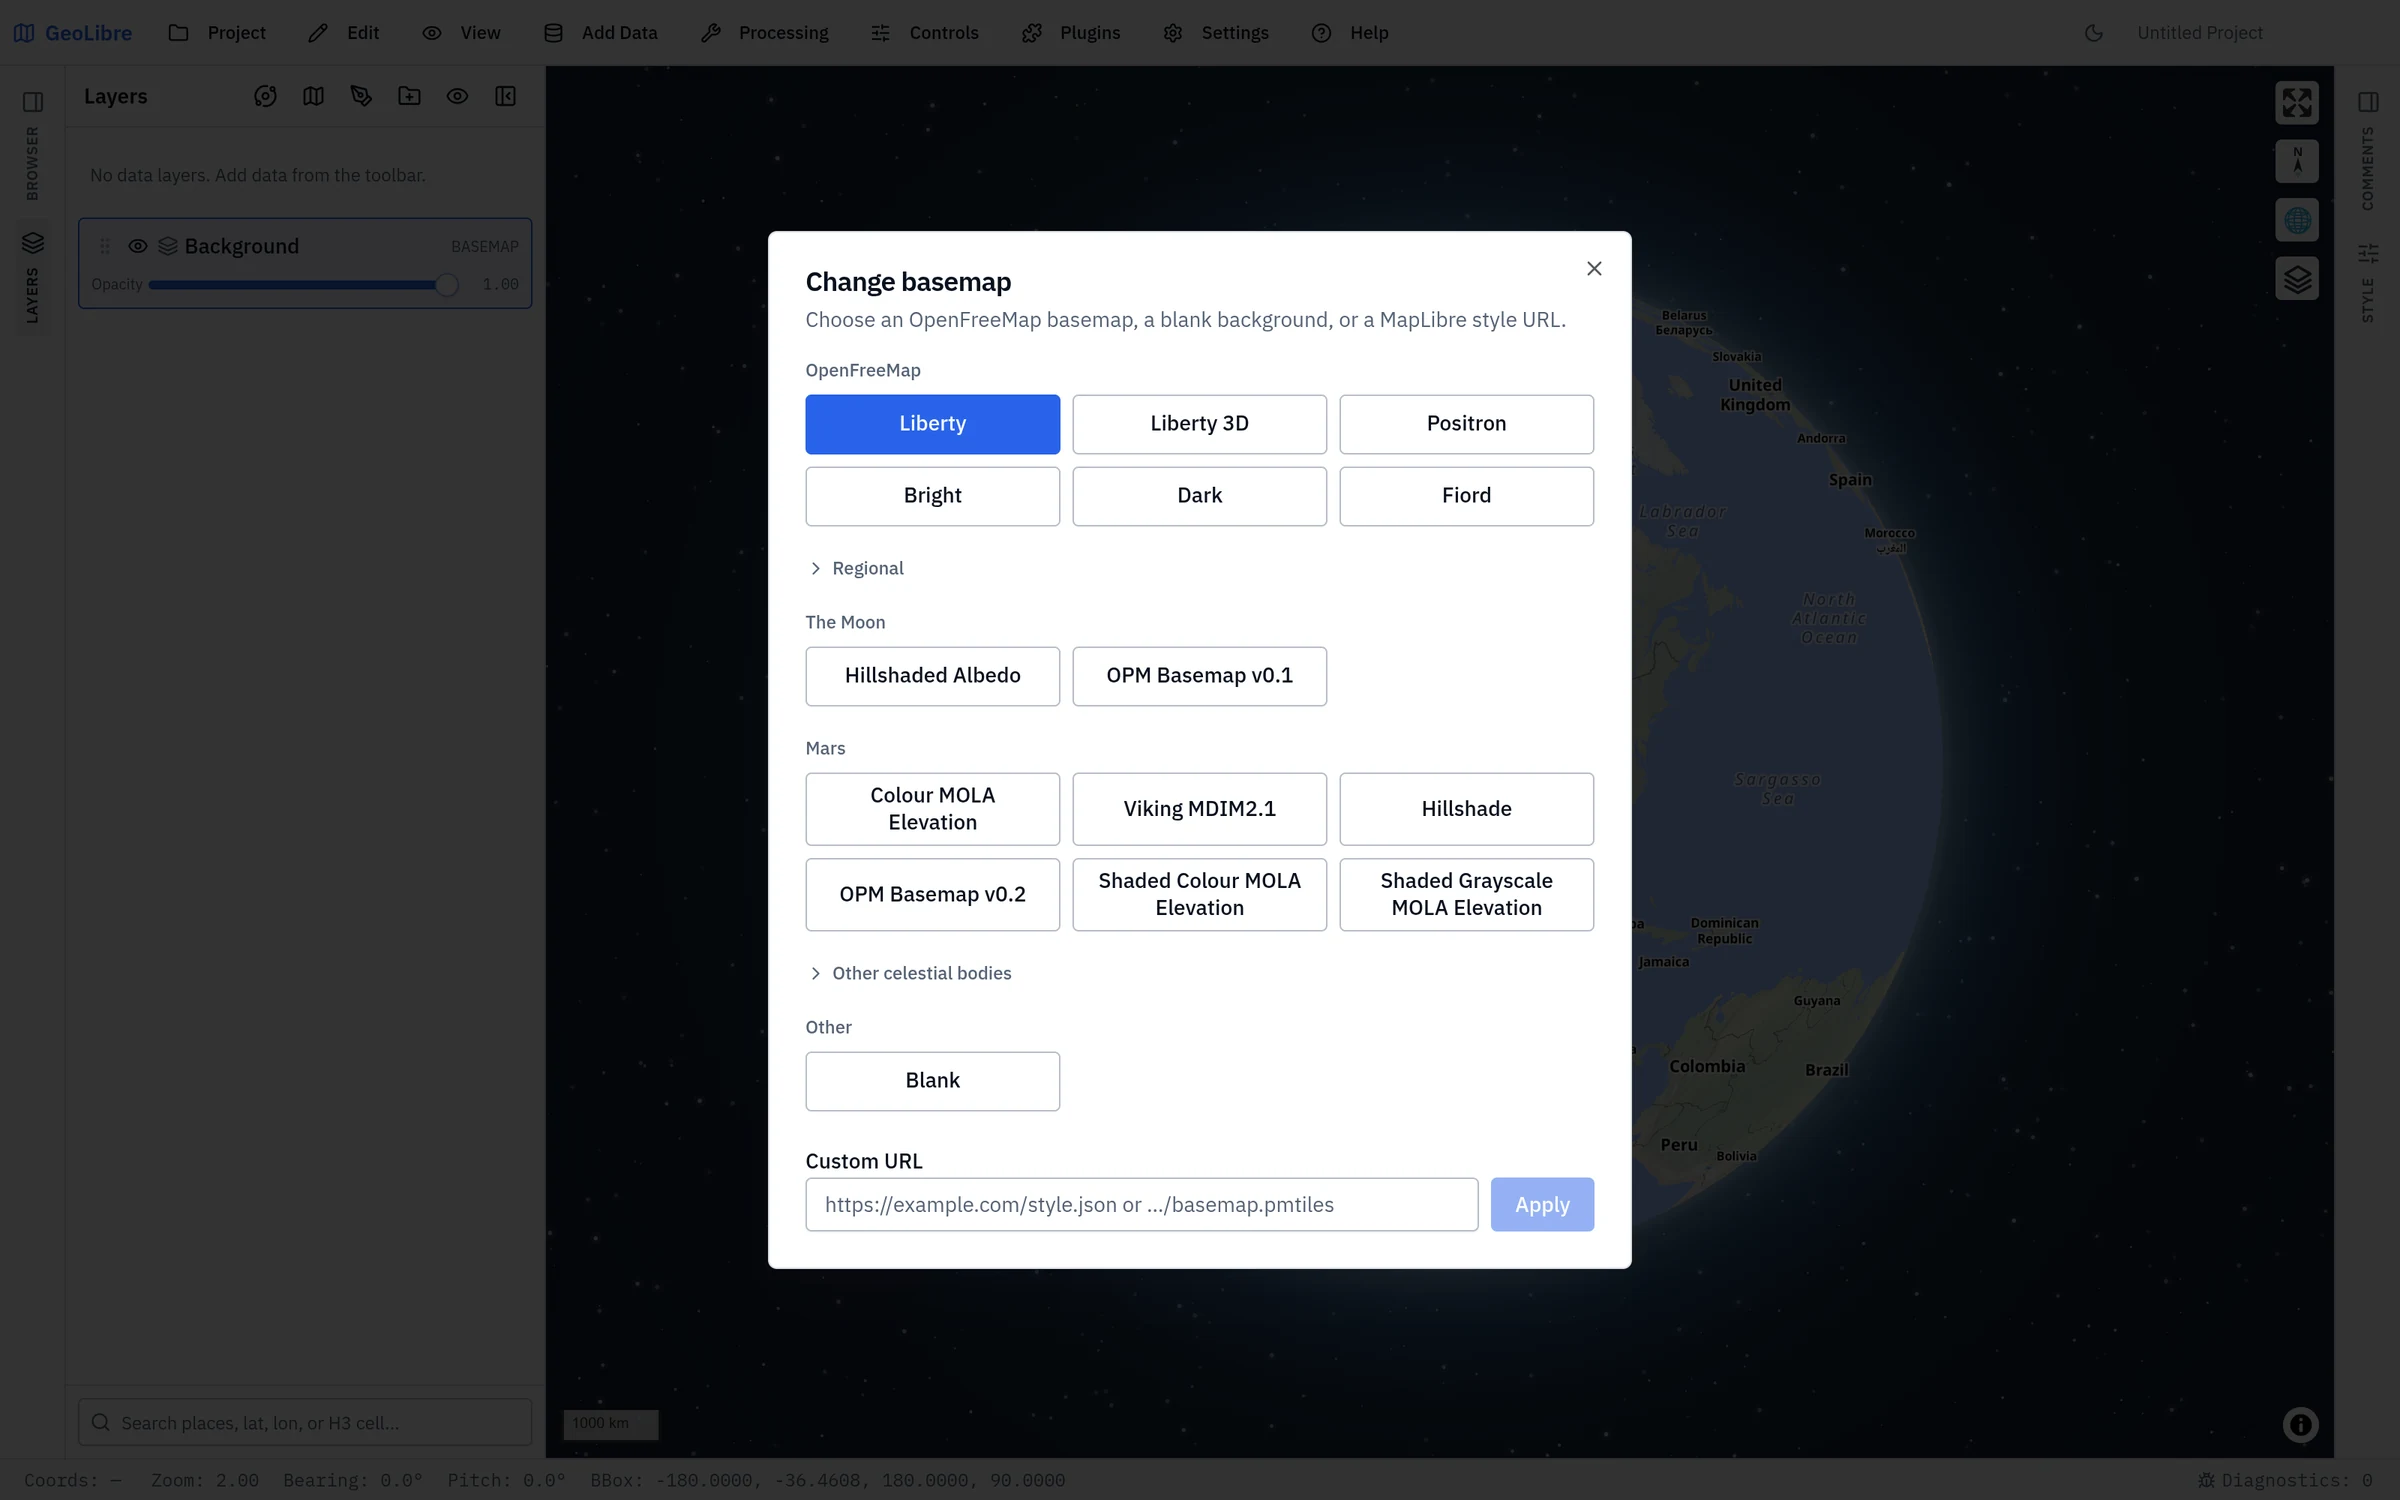
The basemap sits at the bottom of the Layers panel as the Background entry. Double-click that row to open the Change background dialog, or activate the Basemaps plugin from the Plugins menu to switch between OpenFreeMap styles (Liberty, Liberty 3D, Positron, Bright, Dark, Fiord), Protomaps styles (when the build offers them), a collapsible Regional group, a blank background, or a custom style URL. You can toggle basemap visibility and adjust its opacity from the Layers panel.
Other celestial bodies
GeoLibre can map worlds beyond Earth. The Change background dialog and the New project dialog group planetary basemaps into sections for The Moon, Mars, and a collapsible Other celestial bodies section covering Mercury, Venus, the Galilean moons (Io, Europa, Ganymede, Callisto), Titan, Pluto, and Charon. The Moon and Mars mosaics come from OpenPlanetaryMap; the other bodies come from USGS Astrogeology and are reprojected to Web Mercator on the fly so MapLibre can render them.
For quick switching, use the planet switcher (the orbit icon) in the Layers panel header. Selecting a body sets the project's ellipsoid, so distance, area, and scale-bar measurements use that body's radius instead of Earth's.
More data sources
Additional catalogs and providers are available as panels and plugins rather than Add Data items, including Planetary Computer, Earth Engine, Overture Maps, and several federal Web Services. See Data Integrations.
Three of them, grouped under Plugins → Web Services, search public dataset catalogs by keyword and add a result to the map in one click:
| Panel | What it searches |
|---|---|
| ArcGIS Hub | Public datasets published to ArcGIS Hub. Search by keyword or restrict the search to the current map area, page through results, add a supported layer to the map, zoom to it, or download the data. Datasets with several layers download only the first, and the panel says so. |
| Socrata | Public Socrata open-data catalogs, adding their GeoJSON datasets. |
| CKAN | The Humanitarian Data Exchange CKAN catalog, adding its available GeoJSON resources. |
Each panel shows how many of the total results you are looking at and offers Load more to page further. See Web Services for the other browsers in that submenu.
Browser vs desktop
URL-based sources work in both the browser and the desktop app. Local file dialogs, local MBTiles, local raster reads, File Geodatabases, PostgreSQL, and SQL Server require the desktop app. See Getting Started.