7. Extending GeoLibre with Plugins and AI
3:00 - 4:00 p.m.
Lecture 15 min · Hands-on 35 min · Break 3:50 - 4:00
Learning goals
- Find, activate, and deactivate built-in plugins.
- Animate a time-stamped layer with the Time slider.
- Compare historical imagery with Esri World Imagery Wayback.
- Set up the AI Assistant and judge when to trust its answers.
- Know how external plugins are installed and written.
Lecture (15 min)
Plugins
Much of GeoLibre is built as plugins, listed under the Plugins menu:
| Group | Examples |
|---|---|
| Editing and annotation | GeoEditor, Annotations, Dimensions |
| Web services (catalog browsers) | STAC catalogs, USGS National Map, USGS 3DEP, FEMA NFHL, NASA Earthdata, Source Cooperative, OpenAerialMap, OSM downloader, US state and local GIS portals, and more |
| Open map data | Overture Maps, Basemaps |
| Discrete global grids (DGGS) | H3, S2, A5, Geohash, plus codes |
| Time and change | Time slider, Timelapse, Historical imagery, Layer swipe |
| 3D and imagery | Street View, Mapillary, Flight simulator, Elevation profile, God's eye view |
| AI | SamGeo segmentation, GeoAgent |
A plugin that adds layers adds real layers: they show in the Layers panel, can be restyled, and save into the project. Closing a Web services panel deactivates its plugin.
External plugins install from a curated marketplace (Settings → Manage
Plugins), from a zip, or from a plugin.json manifest URL. The
Plugin API documents how to write one in TypeScript.
AI in GeoLibre
- The AI Assistant (Processing → AI assistant) takes requests in plain language ("add the USGS earthquakes from the last week and color them by magnitude") and calls GeoLibre tools to carry them out. It works with Google Gemini, Anthropic, OpenAI, OpenRouter, the Vercel AI Gateway, or a local Ollama model, using your own credentials.
- AI segmentation and object detection (SamGeo, GeoAI) turn imagery into vector features.
- An MCP server and an agent skill let coding agents author
.geolibre.jsonprojects for you (see MCP Server).
Verify, then trust
An assistant can pick the wrong field, the wrong year, or an inappropriate classification scheme. Check its result against something you already know. In this workshop you know Esmeralda County had 1,431 events, so you can test whether an AI-written query gets the same number.
Hands-on (35 min)
Start a new project named NGIS 2026 - 7 Plugins and AI. Load the earthquakes
CSV with Add data → Delimited text layer, as in Exercise 2.2,
with the Layer name Nevada earthquakes:
https://assets.geolibre.app/data/workshops/ngis-2026/nv_earthquakes.csv
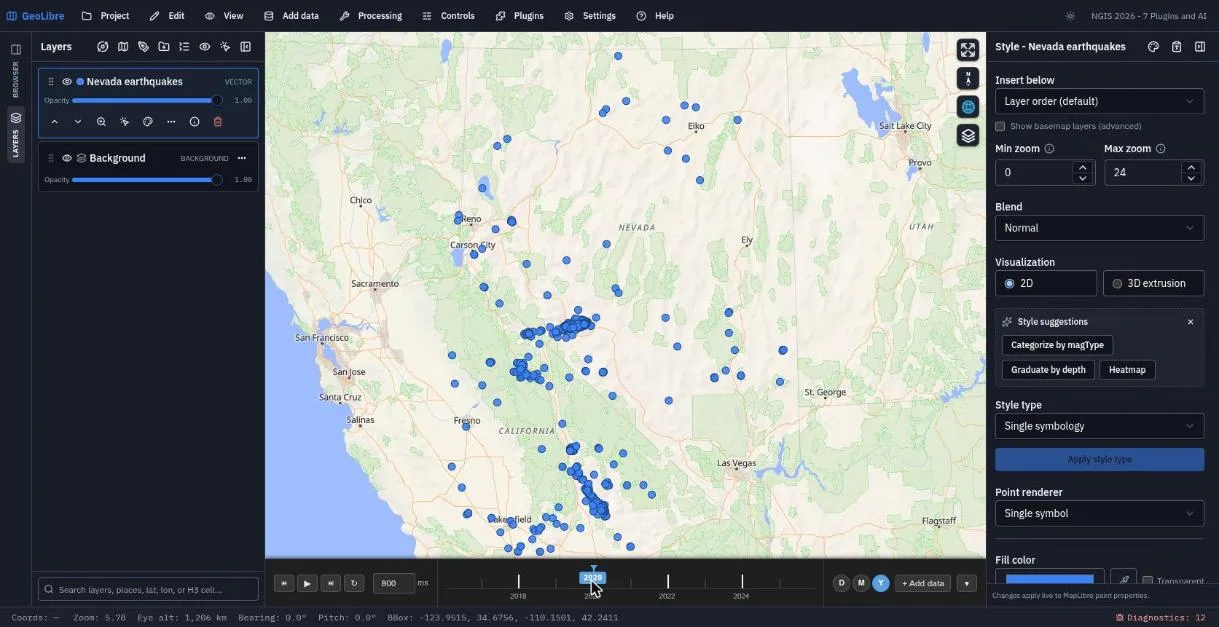
Exercise 7.1: Animate earthquakes with the Time slider (12 min)
- Choose Plugins → Time slider. A timeline appears below the map.
- On the
Nevada earthquakesrow, open Layer actions (⋯) → Bind to time slider.... - Time property:
time. Show features: In the current step. Click Bind. - The timeline now spans 2016 to 2025. Set the step to Y (year) and click 2020. The Monte Cristo Range sequence in central Nevada and the 2019 Ridgecrest aftershocks in California stand out.
- Click play and watch a decade of earthquakes year by year. Switch the step to M (month) and find May 2020.
Exercise 7.2: Historical imagery (8 min)
- Search for
Renoand zoom in to the University of Nevada, Reno campus (about zoom 15). - Choose Plugins → Historical imagery. An
Esri Waybacklayer appears, showing the most recent release, and the panel lists every release since 2014 (about 200 of them). - Drag the Release timeline back through the years and watch new buildings appear. Tick Only versions with local changes to skip releases where nothing changed here.
- Click Add persistent layer to keep the selected release as a regular layer. Closing the panel removes its temporary layer.
Exercise 7.3: Browse a web-services catalog (5 min)
- Open Plugins → Web services and look through the list.
- Pick one that interests you. Suggestions: USGS National Map for topo and hydrography, NASA Earthdata for daily global imagery, OSM downloader for buildings around UNR, or US state GIS to browse Nevada's open-data portal.
- Add one layer from it to your map.
Exercise 7.4: The AI Assistant (10 min)
- Choose Processing → AI assistant. Without credentials it shows Set up the AI assistant and lists the supported providers.
- If you have a key, click Open Settings → AI providers, add it, and
return. To stay entirely local, point the Ollama profile at
http://localhost:11434(see AI Assistant for browser setup). - Try prompts like these and check each result:
- "Zoom to Carson City."
- "Style the Nevada earthquakes layer by magnitude with 5 quantile classes."
- "How many earthquakes in the layer have a magnitude of 4 or more?"
-
For the last prompt, verify the answer yourself in Processing → SQL workspace. The layer is queryable as
nevada_earthquakes:SELECT count(*) AS m4_plus FROM nevada_earthquakes WHERE CAST(mag AS DOUBLE) >= 4;The answer is 262. Note the
CAST: columns of a layer loaded from CSV reach SQL as text, soWHERE mag >= 4fails with Cannot compare values of type VARCHAR and type INTEGER_LITERAL. Did the assistant handle that?
If you have no key, pair up with a neighbor who does, or watch the instructor demonstration.
Save the project.
Check your work
The finished project restores the earthquake layer with the Time slider bound to it and set to 2020.
Going further
- Plugins → Layer swipe compares two layers with a draggable divider. Try it with a Wayback release against the current imagery.
- Plugins → DGGS → H3 overlays the H3 grid. Identify a cell and export the grid.
- Plugins → SamGeo segments imagery into polygons.
- Read Plugins & Marketplace, Data Integrations, and AI Assistant.
Break: 3:50 - 4:00. Next: 8. Sharing Maps and Reproducible Projects